As on a teeter-totter, as on the spot freight market — what goes down must come up. Well, sort of. Spot market volumes on DAT Load Boards continued their climb last week, enough to finally put pressure on rates to rise. The national average van rate was up 4 cents, while 56 of the top 100 van lanes paid better than the prior week. “I told you so,” noted DAT’s Ken Harper, a little facetiously though not entirely. “Seriously, this is a good sign: the peak freight season often starts in March, but usually it’s later.” We’ll see how it pans out in the coming weeks.
Just thirty of the top van lanes saw declines, and most of those were slight. The rest of the lanes held steady.
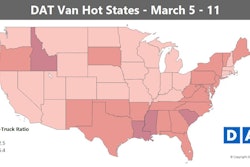
Hot markets: Volumes finally started to improve out of Los Angeles, though not yet enough to turn California dark in the Hot States Map above. The same was true in Chicago, so prices could start to improve in both markets soon. Load counts slipped in Houston — that market has been relatively strong all winter long. Memphis, Atlanta, and Seattle saw the biggest increases in outbound rates.
Not so hot: The only lane on the top 100 to drop more than 10 cents was the lane from Stockton, Calif., to Salt Lake City. The average rate on that lane fell 18 cents to $1.92 per mile.

Reefer trends showed some small signs of reversing course last week, too. That’s good news considering the steady string of declines we had been seeing.
Hot markets: Volumes were up big in McAllen, Texas, down near the Mexican border. It was No. 3 for reefer load posts on DAT load boards, behind Atlanta (1) and Elizabeth (2), N.J. Reefer trucks are in short supply there right now, too, which means you should have an easier time negotiating a good rate out. Miami volumes also surged, but it’s still early for produce season in Florida, as evidenced by the low load-to-truck ratio in the Hot States Map.
Not so hot: California is still missing in action, and outbound rates slipped even lower out of Los Angeles.

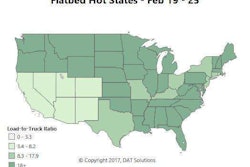
Demand for flatbed trucks continued to climb ahead of schedule. Even California joined the party last week, with higher than normal activity for this time of year.

Hot markets: There’s a whole lot of dark green in the Hot States Map above, representing high numbers of loads versus trucks posted. Flatbed rates got the biggest boosts last week out of Atlanta, Memphis and Baltimore.
Not so hot: Phoenix and Las Vegas volumes have been low, which helps explain why Arizona, Nevada and New Mexico are the only pale-colored states in the map above. Cleveland has also been softer than other major flatbed markets this winter. The lane from Pittsburgh to Houston was surging a couple weeks ago, but it came back down to earth last week.