Rates outbound from Fresno, Calif., lost an average of 6 cents per mile last week despite an increase in refrigerated freight volume. Central California is between seasons now, and load volume and rates may rise in August, however, DAT reports.
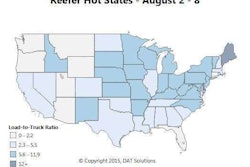
Spot market reefer freight volume continued to cool off last week, but some pockets of high demand remain in New Mexico, Arkansas and the Lower Midwest, as shown the “hot states” map below
Freight is plentiful in individual freight markets where trucks are relatively scarce, including: Albuquerque, N.M.; Lubbock, Texas; Fayetteville, Arkansas; Memphis and Nashville, Tenn.; Cape Girardeau, Mo.; and Evansville, Ind., according to DAT.
From a rate standpoint, though reefer rates on average showed a 2-cent-per-mile drop last week nationally and rates trend down in most major markets, bright spots were obvious in Philadelphia, where rates jumped 7 cents, and Twin Falls, Idaho, which gained 5 cents.
Green Bay, Wis., too, showed strong performance compared to many other markets, with a $2.63 outbound reefer load average rate and two cents higher on average to Philadelphia. The return trip was abysmally low, however, according to rates derived from DAT RateView — an average $1.39, including fuel. The round trip averaged $2.02 per mile, or $3,899 for all loaded miles.
Turn the the round into a “TriHaul,” as DAT calls its alternate-run suggestion tool in RateView, with just 110 additional miles from Philly to Cincinnati and then on to Green Bay with another load, and you could boost that $2.02 average to $2.34, according to last week’s averages. That would be a total additional $877 in roundtrip revenue.
 Darker blue areas indicate statewide load-to-truck ratios that are well above the week’s national average of 4.1 loads per truck on DAT Load Boards. Daily maps, along with detailed information on demand, capacity and rates for individual markets and lanes, can be found in DAT Power Load Boards and in DAT RateView, from which data for this update were derived.