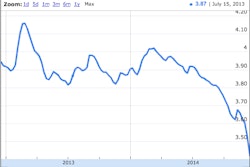
Conditions in the spot market for freight have been uncommonly good this year for owner-operators, writ large, as the above index from DAT, recently updated for the end of November, shows, and as I reported on in more depth as recently as October in the big feature in that month’s magazine. From DAT’s press release accompanying the November update:
Spot market freight availability continued to be strong in November, when volume increased 17 percent compared to the same month in 2013, according to the DAT North American Freight Index. On a month-over-month basis, volume declined in a typical seasonal pattern, dropping 15 percent compared to October.
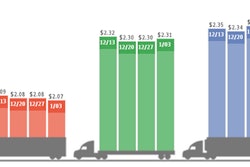
Freight volume increased for the three major equipment types, compared to November 2013: van demand rose 44 percent, while freight availability increased 29 percent for refrigerated (“reefer”) trailers and 13 percent for flatbeds, year over year. Truckload rates also increased for all three equipment types: Van rates rose 16 percent, reefer rates rose 24 percent, and flatbeds added 15 percent, compared to November 2013.
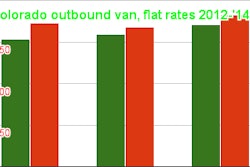
The company also sent along a demand report for all 50 states, showing overall inbound/outbound load count ratios for states, a key gauge for demand. The graphs below show the ratio on a percentage basis — in the first, good places to be last month in general terms for negotiation leverage, marked either “great” or “excellent” in terms of demand outbound. The higher the percentage, the higher the demand, at least according to loads posted to DAT’s boards.
Oregon’s a clear outlier in the data, with nearly six outbound to every single inbound load in the system, suggesting very high demand. All the same, average linehaul rates dervied from DAT RateView outbound from Oregon in November hung down in the $1.40-$1.70-per-mile range, not including fuel surcharges, lower than in states like Indiana ($2.10-$2.60 or so — with some outliers, depending on the destination — and above for the line-haul), also high-demand.
States marked in November for poor outbound demand follow:
All of which is to say, demand metrics change constantly and there’s more than just truck/load supply involved in the overall rate picture. But where you can utilize such metrics with whatever load service you’re using, getting a more accurate picture for your segment is certainly possible, and in most cases a fairly simple matter, with most of the good load board services out there. Do these numbers square with your experiences negotiating this past month?