DAT’s Ken Harper pointed to some “good news” in the weekly trend highlight the company’s analysts are seeing in the spot market activity in their network of load boards. “Load [volume] increases are a harbinger of things to come,” he said, though “we’re probably a little early to call the fall freight season.”
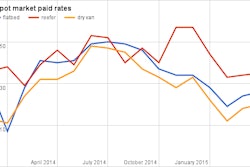
Nonetheless, volume was up 5 and nearly 9 percent, respectively, in van and reefer, and the maps below show just where the increases were the most pronounced. The only segment showing volume declines was flatbed, though the rate picture in that segment holds some positives for operators, says DAT.
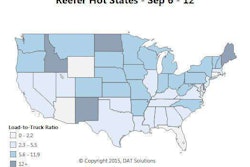
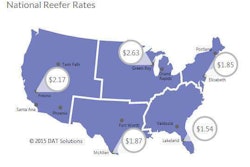
 Reefer freight led the segments in volume increases last week with a national 8.5 percent boost. At once, rates lost another 8 cents per mile as a national average, in part due to declining fuel prices but also due to sub-par harvests in dry California. Rates trended up last week in the Northeast and Midwest, where early crops are heading to market and grocery chains are stocking up on perishable items for the back-to-school season. Outbound rates rose in a handful of markets, including: Twin Falls, Idaho; Chicago; Green Bay, Wis.; and Elizabeth, N.J.
 The load-to-truck ratio heated up in the Northeast and parts of the Midwest, as shown in the map for the week of August 2-8. At the same time, given the concurrent drop in fuel prices, spot market van rates (reflecting fuel surcharges) dropped 3 cents to a national average of $1.79. Rates rose last week in individual freight markets, including Philadelphia; Buffalo, N.Y.; Chicago; and Charlotte, N.C. Darker red areas indicate statewide load-to-truck ratios that are well above the week’s national van average, which rose to 1.9 loads per truck on DAT Load Boards from 1.7 a week ago.
 Where load volume was done: Flatbed. Load availability dipped 2 percent last week, but the national average rate increased by 2 cents per mile on the spot market. This comes despite a decline in fuel prices as well. Rates trended up in Houston, a major flatbed market, as well as secondary markets like Las Vegas; Fort Worth, Texas; Cleveland, Ohio; and Tampa, Fla.
All rate data herein are derived from DAT’s RateView product, and are based on actual rate agreements between freight brokers and carriers. Reference rates include fuel surcharges but not accessorial or other fees. See base rates adjusted for fuel in the segment pages at DAT’s Trendlines website.