Traffic on the interstate highway system dropped 45% during the initial stages of COVID -19, but has since returned almost to pre-pandemic levels.
Updated March 17, 2023, with more current information and context.
Any driver who spends enough time on the interstate highway system can speculate about which cities and states have the worst traffic and road conditions, but a report from TRIP, a nonprofit that researches transportation trends and needs, reveals its calculation of the worst offenders.
TRIP's report, released in 2021, coincided with the 65th birthday of America's interstate highway system, concluding that it direly needs repair and investment. The report came amid a national debate over interstate funding and when the freight market was running hotter than ever before.
 The chart above ranks states whose Interstate systems are the most congested, have experienced the greatest increase in vehicle miles of travel (VMT) since 2000, are busiest (based on daily travel per lane mile), have the largest share of pavement in poor condition, and have the greatest share of bridges in poor/structurally deficient condition.TRIP
“Our rapidly deteriorating infrastructure is a clear and present danger to our nation’s supply chain. Breakdowns in the Interstate Highway System add an annual $75 billion to the cost of freight transportation, and 67 million tons of excess carbon dioxide emissions are released into the atmosphere every year from trucks stuck in traffic congestion,” Chris Spear, president and CEO of the American Trucking Associations said in a statement on TRIP's report. “This report quantifies how severe this crisis has become, and it underscores the urgent need for Congress to make real infrastructure investments that are backed by a fair and equitable user-based revenue source.”
TRIP's report looks at which states have the most traffic and worst road conditions based on a 2019 report prepared by the Transportation Research Board at the request of Congress. Other reports have looked into more recent data on states with the most structurally deficient bridges, and the American Transportation Research Institute's annual ranking of worst traffic bottlenecks gives a better idea of which specific places see the worst traffic.

Here's what the report said about America's highways in 2021:
Traffic is back
"During the initial stages of the COVID pandemic, we saw a 45% drop in overall vehicle travel on the nation's interstate highway system, but by this April vehicle travel on the interstate highway system is only 6% below pre-pandemic levels," the report said.
In other words, the pandemic-induced holiday from heavy traffic is mostly over.
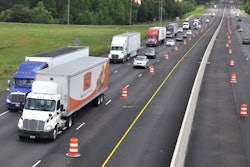
States with the worst traffic
California, Maryland, New Jersey, Delaware, and Florida have the worst congestion. California's congestion rate is 40 percentage points higher than the national average of 47%.
As previously mentioned, ATRI's 2022 report on the worst traffic bottlenecks gives more granular and timely data on which specific interstates and and intersections see the worst traffic.
States with the worst-paved highways
Thankfully, the state with the most extreme percentage of poor roads isn't one an OTR hauler can visit. Hawaii has 23% of its interstate highway pavement in "poor" condition, according to the report. This runs 20 percentage points higher than the national average of 3%.
Delaware, New Jersey, Louisiana, and New York make up the rest of the top five, though they range from 9% to 6% of interstate pavement in "poor" condition.
Arizona did not make the list of 20 state with the worst-paved highways in 2021, but since then it's emerged as the most despised stretch of interstate in the country for truck drivers. "Rougher than a corncob," in fact, according to many drivers who spoke to Overdrive.
[Related: States with the most structurally deficient bridges]
Highway design is saving lives
Despite concerns over ailing infrastructure, the TRIP report says that years of certain highway improvements have mostly worked to reduce fatalities.
The report says safety features like the separation from other roads and rail lines, a minimum of four lanes, paved shoulders and median barriers make interstates more than twice as safe as all other roadways.
"The fatality rate per 100 million vehicle miles of travel on the Interstate in 2019 was 0.55, compared to 1.30 on non-Interstate routes. TRIP estimates that additional safety features on the Interstate Highway System saved 6,555 lives in 2019," the report said.