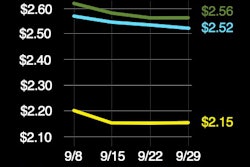
The top line in this graph shows the all-in national average van rate and how it’s tracked over the last year, according to DAT — separate out fuel’s volatility and generally rising price over the last year, represented by the bottom line, and underlying rate gains are clearly more muted.
Spot market line-haul van rates, separating out fuel’s effect, are just 5 percent higher today than they were a year ago, having risen from $1.74 to $1.83 per mile during the week ending Oct. 6. And the number of van loads moved via the DAT load board network in this time frame is nearly identical to the same period in 2017.
One might expect this first week of October to be considerably different compared to last year, when the effects of Hurricanes Harvey and Irma continued to be felt throughout supply chains and many owner-operators and small carriers were grappling with ELD adoption ahead of the December 2017 mandate. Business and economic conditions have changed a lot in the past year, too.
But freight, mostly, has “normalized” on the spot market, compared to last year. An increase in capacity in the market, especially among small and mid-sized carriers, may be keeping spot rates in check.
The number of available trucks on DAT load boards increased 8.3 percent during the most recent full week, while the number of posted loads declined 13 percent. The top 100 van lanes saw volumes back off from a strong finish to September, when shippers were pushing freight out the door before the close of the quarter, as usual.
While the spot van rate actually rose 2 cents to $2.17/mile as a national average, the trend is somewhat bearish for rates. With more trucks and less freight on the spot market, somewhat usual this time of year, average rates decreased on 68 of the top 100 van lanes in the United States. Nine lanes were neutral and rates increased on only 23 lanes.
The national van load-to-truck ratio fell 23 percent back to 5.6 loads per truck last week. Demand for other types of trucks declined as well: the reefer load-to-truck ratio fell 18 percent to 6.9 loads per truck, while the flatbed load-to-truck ratio was down 15 percent to 22 loads per truck. In other periods when carriers had pricing power, capacity expanded quickly to bring the marketplace back into balance. Still to be seen is whether the coming holiday season and e-commerce demand result in a meaningful spike in rates during the fourth quarter, as has occurred in the past.

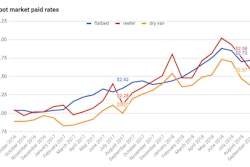
Pulling in data from a recent Truckstop.com Trans4cast weekly update, among some state hot spots in its recent-history average Load Availability Index top five — Utah, California, Indiana, Oklahoma and Rhode Island — all but California showed year-over-year rate gains as of the end of last month, reflecting the analysis above. But the trend was negative on a week-over-week basis in all those states but Utah, where outbound rates were up 1.5 percent for the next-to-last week in September.
For major segments considered nationally, too, signs pointed down in both monthly and weekly data at the end of September via Truckstop.com. More month data is available via the following link: