 Overdrive’s ongoing series of reports examining individual state truck enforcement departments has to date included reports on Maryland, Pennsylvania, Connecticut and Texas. For news and data related to the CSA program and various enforcement issues, access updated state data on inspection intensity, violation priorities and more via the maps and downloads available via OverdriveOnline.com/csa.
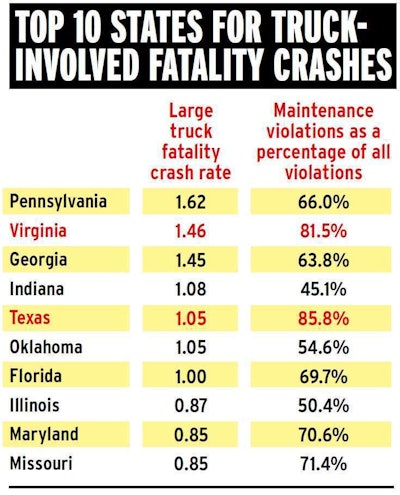
Only two of the states with the biggest truck-involved fatality-crash problems show a percentage of maintenance violations above the 2013 national average of 72.6 percent – Virginia and Texas. The violation profiles of the other states reflect a safety approach that focuses more on violations associated with the most common crash causation factors – elements of driver behavior.
In the American Transportation Research Institute’s summer 2014 report on regional disparities in inspections and violations, the Texas Department of Public Safety’s program was singled out. The report highlighted the ratio of speeding violations to light violations issued by various states, computed by the Vigillo company. The report found that “the national average was 11.97 light violations for every speeding violation.” The ratio varied from a low of 1.91 in Indiana to [a high of] 321.02 in Texas.”
 SOURCES for above: Fatality crash statistics from the National Highway Traffic Safety Administration for the 2012 calendar year per 100 lane-miles of National Highway System roadway in each state. Maintenance violation percentages are from FMCSA data for calendar year 2013, analyzed by Overdrive and RigDig Business Intelligence.


