National truck inspection numbers rose nearly 20 percent between 2011 and 2013, the early years of the Federal Motor Carrier Safety Administration’s Compliance, Safety, Accountability program. Then, due to various factors, that total fell by close to 10 percent last year.
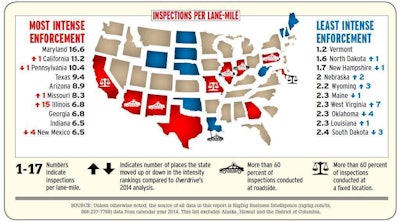
Large regional disparities in the behavior of state truck enforcement departments that do the inspections and write the violations have continued, though some states have changed their inspection and violation priorities.
 Click through the image for more state-by-state inspection and violation statistics for the lower 48 continental United States.
These changes are highlighted in Overdrive’s latest update to its ongoing CSA’s Data Trail analysis. In addition to what’s shown here, there is much more detail via our hub for the interactive top-ten maps for inspection intensity, violation priorities and more as well as full 48-state data in all categories available for download.
One possible factor in the nationwide decline in inspections is the growing movement against CSA within the industry and even some areas of law enforcement. Overdrive readers are no exception.
 THE SEVEN-STATE SPEED TRAP | Click here or on the image for a look at the violation priorities of these seven contiguous states. All show speeding within the top six violation categories tracked by Overdrive. Several, furthermore, are top states for moving violations overall.
When they were asked in spring 2014 whether public CSA Safety Measurement System category “scores” should be pulled from public view, “yes” answers accounted for 68 percent of responses. Since then, there have been widespread investigations, in venues ranging from these pages to Congress, of the program’s inequities. In reader polling this spring, more than 80 percent of readers now say “yes” to pulling back the program’s reins.
Should carriers’ CSA SMS scores/rankings be pulled from public view?
“I think there’s a lot of legitimacy to the movement until these scores are fixed,” said Dan Murray, American Transportation Research Institute vice president. Speaking in April at the Truckload Carriers Association’s Safety & Security Division meeting, Murray said that as a result of industry pressure, he believes a “sea change in CSA” is coming in two to three years so that it “somehow becomes useful to industry.”
Chief among the program’s problems today are the percentile-ranking nationally comparative nature of the CSA SMS’ categories of measurement and the fact that the rankings/scores are available publicly. The problems are due in part to the widely diverging tactics and approaches to inspection selection and other enforcement at the state and local levels.
As Murray noted, results of ATRI’s relatively recent shipper survey on CSA showed that “96 percent [of shippers] were checking existing carrier accounts’ scores, and 100 percent were checking prospective accounts.”
Since its introduction in March, not much seems to have happened with H.R. 1371, the House bill that would require a concerted study and revamp of the program, including pulling SMS percentile rankings/scores from public view. Attempts to move similar language into drafts of the next highway reauthorization may surface again during the next round of talks. Nonetheless, CSA’s inequities and irregularities remain a topic of large concern throughout the industry.
Though inspections fell in 2014, the intensity spread among state enforcement departments continued to range widely. Measured by inspections conducted per lane-mile of National Highway System roadway, it was as high as 17 in Maryland and as low as one in Vermont. Also extremely divergent among states are violation profiles.
If there’s any ongoing trend, it’s “definitely a movement to more moving and hours of service violations,” says Steve Keppler, Commercial Vehicle Safety Alliance executive director.
MORE:
Georgia
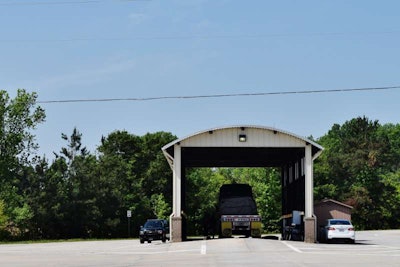
 Reflecting a national downward trend, Georgia’s inspection numbers fell in 2014, a result of continuing manpower issues as the state makes efforts to do more with less utilizing technology. Click here or through the image for more.
Illinois
 Illinois’ inspection numbers made the largest single movement nationwide, upward 15 places into the top ten for inspection intensity for 2014. The increasing intensity is a result of a shift in priorities for the state’s 900-plus Level 3 certified state troopers toward driver inspections following the loss of two of their own. Click here or on the image for more on the state’s enforcement program.


