In Overdrive’s annual CSA’s Data Trail update, a little later than usual this year, after a few years of decline in the totals overall, RigDig’s count of inspections associated with a U.S. Department of Transportation number increased by more than 4 percent. Fortunately for operators, those additional thousands of inspections can be attributed in part to an influx of inspections that contained no violation.
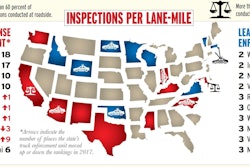
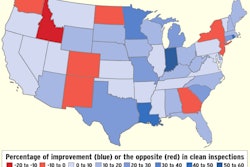
All but eight of the 48 continental United States showed small to marked increases in the percentage of inspections that were clean, which helps a carrier’s CSA scores.
Last year was the first full year to pass since those scores were pulled behind the curtain from the public by Congress, after lawmakers got an earful from truckers over issues of data quality, scoring fairness and more.
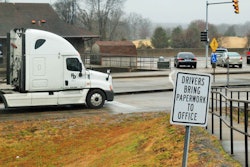
States finally appear to be responding to a long push from truckers and, in some senses, regulators and lawmakers to get more jurisdictions to “finish the job” on clean inspections. That means inspectors go through the steps to file a Level 3 driver-credentials inspection, at least, with any quick check that otherwise might not rise to the status of a full Level 1 truck and driver inspection.
“There is a concerted effort among the states to complete inspection reports when no violations are found,” says Collin Mooney, executive director of the Commercial Vehicle Safety Alliance. The coalition of law enforcement and trucking concerns oversees the national inspection program’s levels, out of service criteria and more. “That can be a little subjective in terms – it’s not always the case that a report should be generated” after every stop at the roadside or quick glance through a log book at a weigh station. All steps required by CVSA’s inspection-level definitions must be completed to file an official inspection.

In 2016, nearly 46 percent of all inspections recorded in the states were totally clean inspections. That number has been growing slowly since 2010, the first year for which Overdrive tracked statistics in its CSA’s Data Trail series, when the number was just 38 percent. The trend accelerated in 2015 and 2016. If that rate continues through 2017, the next update could well show an overall majority of inspections resulting in no violations.

Another reason for the rise in clean inspections also could be truckers’ increased attention to ticky-tacky compliance points regarding the vehicle, hours of service and other issues.
California Highway Patrol Lt. Robert Nance nods to his state’s in-use diesel emissions rules as another factor in this trend. “A lot of what we’re seeing are newer trucks out there,” some bought to comply with the state’s tight emissions rules and, being newer, less likely to have maintenance-related violations.
What he calls “voluntary compliance” also is becoming more common as carriers seek out Level 1 inspections, the most comprehensive truck and driver inspection. California, unlike some other states, often is happy to oblige.
Arizona Department of Public Safety Capt. Brian Preston reports similar dynamics in his state, which like California is also in the inspection-intensity top 10. That’s particularly true during all-hands-on-deck events such as the annual Roadcheck inspection blitz.
“Especially during Roadcheck, if someone volunteers for a Level 1 inspection, we’ll do it if we can accommodate you,” says Preston, who cites the benefit many companies offer drivers for getting a clean Level 1 (often $100 or more) as fueling this trend.

Nance says within CHP, the CMV enforcement unit also maintains an outreach program: the Commercial Industry Education Program. “We go out to the carriers and do education at the terminals” on “what they can do to improve and make sure they’re working with us.”
With the advent of the CSA program in late 2010, “every violation … on an inspection report” was newly given weight toward carrier safety scores, Mooney says. Carriers of all sizes turned more focus to reducing inspection violations. “An increased focus on mechanical fitness and driver certification” resulted.
Hours of service compliance seems to have made that turn, too, as more carriers have begun using electronic logging devices, Mooney says, mandated for most as of last week. In 2014, 2015 and 2016, total hours violations fell in both raw numbers and as a share of all violations.
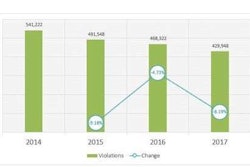
“Violations declining across the board makes sense,” he adds. That’s another reality unearthed in 2016 numbers. While overall inspections rose, total violations fell in Overdrive’s analysis by 5.6 percent.
Captain Preston in Arizona concurs with that notion, particularly relative to Level 3 inspections within his state, which are likely only to unearth hours or credentials violations (like an invalid/outdated medical card) if not occurring alongside a stop for a moving-type violation such as speeding.
“We’ve seen a big drop in Level 3 inspection violations,” he says. That’s partly a result of so many carriers’ turn to e-logs and the virtual elimination in such operations of so-called “form and manner” hours violations, the largest category of hours violation.
Hours violations in 2016 broadly were down by 15 percent compared to 2014, when they reached a recent-years peak.
Unless an operator using e-logs obviously is over hours or has disconnected his ELD in the past eight days, there isn’t a lot roadside can argue with other than finding evidence to prove inaccurate accounting of non-driving time – an often cumbersome process. Most truckers with fleets using e-logs, Preston argues, have become less concerned with roadside officers inspecting logs than with “some safety manager’s phone going off” to report the driver’s over his hours.
In short, Preston and CVSA’s Mooney believe ELDs will continue to lead a fall-off in hours violations. With vehicle-related violations also falling off – the 2016 vehicle violation total was 8 percentage points less than that recorded in 2014 – and with increasing focus on improving the data well for CSA to score carriers, expect attention to continue to focus on moving violations.
Those violations had been rising as a share of the total for years, even though the number of the violations kept dropping. 2016 was no exception, but for the first time in the last few years, the raw numbers of moving violations recorded actually increased in 2016 by 2 percent.
Mooney says a lot of ticket-writing activity at the roadside isn’t captured in these numbers today because many state jurisdictions employ people who are outside the CMV-enforcement umbrella. A citation for speeding from a trooper who is not CVSA-certified, for instance, won’t be accompanied by any inspection and thus “does not make its way to CSA.” Not so for CVSA-certified inspectors, but depending on the time available, they may not complete an inspection report themselves.
The congressionally mandated National Academy of Sciences report on CSA, issued this year, recommended identification and use of new sources of data for the system that underpins carrier scores. One of those sources, says Mooney, could well be local court systems’ records of adjudicated citations, perhaps to contribute to the Unsafe Driving category in CSA post-adjudication. This could mean the driver and/or carrier will be held accountable in scoring for the infraction only if a conviction occurs.
It’s “something we’re actively trying to troubleshoot and work on with the court systems,” Mooney says, calling it a “long-term strategy with FMCSA and state partners. It’s one thing to know the ticket is written, and quite another to know that it’s been adjudicated.”
He believes including post-adjudication citations in CSA would be a significant “enhancement of the program – you’re capturing more data in a category that’s incredibly important. If you do it on the post-adjudication side,” after it’s been decided in court, then the cumbersome DataQs process to deal with adjudicated citations in the CSA system is “irrelevant.”
Difficult though it may be to make the change, Mooney notes that it’s human behavior, not mechanical fitness or driver credentials, that contributes most clearly to the cause and severity of most crashes.
“The biggest thing we’ve seen a change in over the last few years is distracted driving as a result of the introduction of smartphones – it’s clearly a health hazard for all of us,” he says. With more enforcement of such moving violations committed by both truckers and the motoring public, “we hope we’ll see the crash rates decline over time. But right now, they’re increasing.”
Next in this series: Many readers feel little change in clean inspections