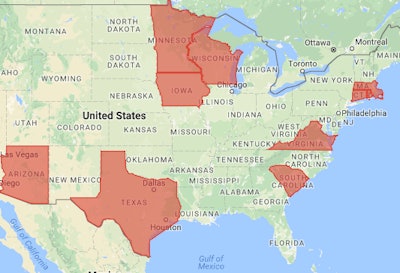
The interactive map above, from Overdrive‘s CSA’s Data Trail main hub charting inspection/violation statistics nationwide, shows the toughest ten states when it comes to violations written during truck and driver inspections, regardless of the violation category. 18 total states, however, place above the national average of national average of 1.7 violations, which is down from a 1.8-violations high in year 2012.
| 18 toughest states for violations per inspection |
For a few years now, that average has been stable, while in states such as Iowa, inspection selection trends show success moving toward a greater focus on the use of visual cues and carrier profile data to target carriers’ trucks and drivers officers believe really need the inspection. Technology has helped that, and Iowa officials are moving to institute a “virtual weigh station” concept that combines weigh-in-motion equipment on the interstate with nearby roadside officers monitoring passing trucks’ carrier data to further bolster targeting efforts without delaying non-targeted truckers.
“We’re working to finalize a virtual concept on one area on I-35 potentially,” says Iowa enforcement Chief David Lorenzen. “We haven’t nailed anything down yet, but we’re hoping to get that deployed in the next 8-10 months.”

Seven of the violation-intense states here have been profiled in the CSA’s Data Trail series since 2014. Click on linked state names in the rankings for profiles of Connecticut, Wisconsin, Texas, Arizona, Virginia, Arkansas and Indiana.
Peruse more extensive data and information from CSA’s Data Trail via this link.