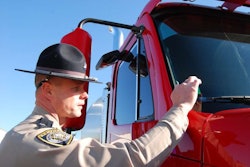
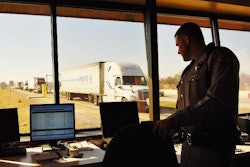
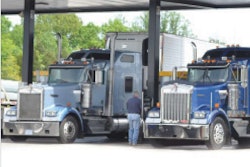
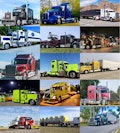
An infographic posted on Overdrive sister site CCJ — and part of Overdrive‘s yearlong CSA’s Data Trail series — shows some of CSA’s most disparate data by pointing out the four to one ration in which owner-operators are inspected, compared to large fleet drivers, and the much higher out-of-service rate of independent drivers and independents’ trucks. Click through the image below for the full infographic.

Brought to you by CCJ Magazine