Find interactive presentations of a raft of state-to-state enforcement data via this link.
Total inspections nationwide fell by less than a percentage point in 2013, but in Pennsylvania, Georgia and other high-traffic areas, inspectors cranked up their activity.
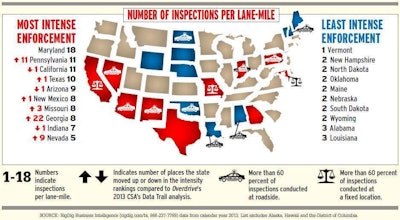
The state rankings shown below for overall inspection intensity are based on two measurements. One is the total truck and driver inspections performed during 2013. The other is total lane-miles of National Highway System roadway within each state.
Following Overdrive’s report on 2011-2012 data last year, many of the same states remain in the list for 2013, with Maryland once again at top. New states in the top 10 include Pennsylvania, Georgia and Nevada, all of which climbed the rankings in a big way.
Significantly, Pennsylvania and Nevada conduct more than 60 percent of their inspections at roadside (indicated by the police car symbol on the map), which often indicates a strong focus on driver-only inspections and moving and hours violations, rather than maintenance violations.
Access an interactive version of the following map and others plotting clean inspections and a bevy of violations via OverdriveOnline.com/csa. There you’ll also find downloads listing the 48 continental states’ inspection numbers and violation priorities.


