Spot van and reefer rates gained a little steam last week as jurisdictions ease shopping restrictions and retailers look to move goods ahead of the Fourth of July holiday.
The number of available loads on the DAT network of load boards increased a substantial 15.6% compared to the previous week, and national average van and reefer line-haul rates were higher than where they were before the COVID-19 coronavirus crisis began in February.
A 3.5% decrease in the number of posted trucks resulted in a boost to load-to-truck ratios, also helping elevate rates.
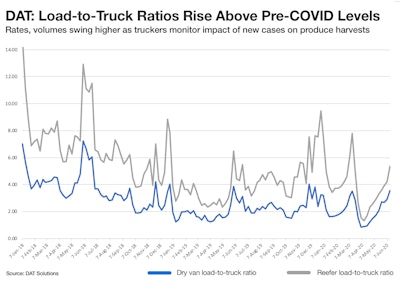
 Load-to-trucks ratios last week, helped along by the produce season, had surpassed their pre-pandemic levels.
National monthly average spot rates through June 22
**Van: $1.76 per mile, 16 cents higher than the May average
**Flatbed: $2.04 per mile, 14 cents higher than May
**Reefer: $2.11 per mile, 9 cents higher than May
Those are rolling averages for the month and current rates are trending upward. On June 1, the van spot rate averaged $1.72 a mile, flatbed sat at $1.98, and the reefer rate was $2.08.
Trend to watch: COVID cases in ag markets
This week we’re seeing reports of some states slowing their pace of reopening as new coronavirus cases climb across the southern tier of the country, where produce season is in full swing. Since agriculture is classified as an essential service, health officials are not likely to shut down crop harvesting operations, so it’s not yet clear how new cases will affect truckload volumes in the near term. If we follow recent Midwest meat-packing plants trends, spot labor shortages, declines in production, and higher truck wait-times are almost certain to follow.
It is interesting to note that four of the top five counties for COVID-19 cases (Imperial, Calif.; Yuma, Arizona; Yakima, Wash.; and Durham, N.C.) are at the heart of major farming states, accounting for 68% of total U.S. produce tonnage according to USDA data.
Market to watch: Memphis vans
Van load posts and rates are now tracking closely with 2019 levels. At 3.6 loads per truck, the national average van load-to-truck ratio is actually higher than the June 2019 average, and average rates fell on just 11 of DAT’s top 100 van lanes by volume last week.
Volumes and rates are increasing out of e-commerce and retail hubs like Memphis. Compared to the previous week, spot van prices rose on several key outbound lanes:
**Memphis to Atlanta increased 16 cents to an average of $2.40 per mile
**Memphis to Indianapolis was up 20 cents to $2.23
**Memphis to Columbus gained 19 cents to $2.14
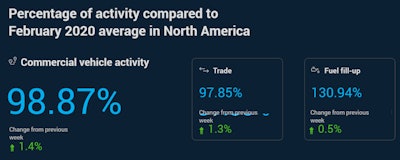
These shorter hauls are indicative of how the truckload freight market is changing. Using telematics data from their install base of 2 million commercial vehicles, Geotab reports that even though the daily volume of truck trips in the U.S. was down 11% last week compared to pre-shutdown baseline levels in February 2020, the number of daily fuel fill-up events are on the rise, an indication that trucks are running shorter trips with multiple stops.
 This snapshot from Geotab’s commercial transport recovery dashboard reflects activity data through June 19.


