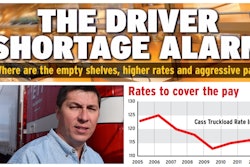
If the above graph looks familiar, you may have read Overdrive‘s recent analysis of economists’ forecasts of a “driver shortage.” Part of that analysis was a similar look at driver pay and owner-operator income long-term. This graph, from an FTR Transportation Intelligence online seminar, charts the growth of company-driver and manufacturing-employee wages and inflation of the consumer price index. As FTR’s Noel Perry put it, “what cost a buck in 2000 now costs $1.38.”
Pay for manufacturing workers, with whom carriers are traditionally considered to compete for workers (along with those in the construction industries), Perry noted, “has exceeded consumer inflation. The trucker, however, has not been nearly as fortunate,” as growth in pay has lagged below inflation through much of the time period since the year 2000. (Overdrive‘s recent analysis went back to 2005.)
The chart, Perry said, “helps explain one of the reasons it’s hard to recruit drivers – we’re still not paying them very much.”
Though 2014 and ’15 showed a better trend, with pay rising fairly sharply for company drivers and independents alike, there’s evidence from carrier surveys that such increases have now lulled. Lower freight volume expectations indicate increases in driver pay will be limited in 2016, according to a fourth quarter survey of carriers by Transport Capital Partners. A large majority of carriers surveyed (70 percent) said they expect wage increases of only 1 to 5 percent, while 22 percent of carriers expect to see no wage increases at all.

But FTR’s Perry also offered forecasts relative to what leverage he expected in both contract and spot rate negotiations through the year, and predicted a measure of growth in truckload freight throughout 2016 on par if not slightly better than 2015, on average. His thoughts on each of the following charts are included below each image.
 The above could represent what Perry considers a “reasonable forecast for the year, but at the same time, you better be cautious” of downside risks, of which anyone paying attention to the stock markets around the world will be well aware. A significant global slowdown could bring the U.S. along for the ride. 2017, he added, shows much weaker in the graph given downside risks becoming more prominent in the wider global economy. The 2017 picture is what this year could look like if downside pressures build enough, he added, in which case “we’re talking down to 1 percent growth, not three percent.”
 If the freight forecast for 2016 depicted in the previous graph holds, Perry said, “What does it mean for pricing? 2014 was a very good year, particularly in spot market pricing. In 2014 that market was extremely tight.” In 2015, contract and spot positions reversed. In 2016, “we think this will reverse again.” Look for real rate growth in the spot market this year provided the wider downside risks don’t change the freight picture.
![At once, looking out to 2017 and projecting capacity utilization measures up to 100 percent of the active truckload fleet in the U.S., upward pressure on rates could well be the result, provided the wider economy doesn’t take a significant dive. Perry noted the upward utilization forecast shown here is the projected result of the effect of a bevy of regulatory items coming into play at once, including the Federal Motor Carrier Safety Administration’s electronic logging device mandate at the end of 2017, the establishment of the drug and alcohol clearinghouse database, and potentially a mandate for speed limiters. “The only portion of the industry that objects to [those items] is the small fleets and the owner-operators,” Perry added. Unlike with the hours of service and CSA changes mandated by Congress in recent times, he expected small fleets and independents in these cases not to be joined by larger fleets. FMCSA, he added, may thus be less likely to “get a lot of resistance.”](https://img.overdriveonline.com/files/base/randallreilly/all/image/2016/02/ovd.FTR-capacity-utilization-history-and-forecast-02-2016.png?auto=format%2Ccompress&dpr=2&fit=max&q=70&w=700) At once, looking out to 2017 and projecting capacity utilization measures up to 100 percent of the active truckload fleet in the U.S., upward pressure on rates could well be the result, provided the wider economy doesn’t take a significant dive. Perry noted the upward utilization forecast shown here is the projected result of the effect of a bevy of regulatory items coming into play at once, including the Federal Motor Carrier Safety Administration’s electronic logging device mandate at the end of 2017, the establishment of the drug and alcohol clearinghouse database, and potentially a mandate for speed limiters. “The only portion of the industry that objects to [those items] is the small fleets and the owner-operators,” Perry added. Unlike with the hours of service and CSA changes mandated by Congress in recent times, he expected small fleets and independents in these cases not to be joined by larger fleets. FMCSA, he added, may thus be less likely to “get a lot of resistance.”
At once, looking out to 2017 and projecting capacity utilization measures up to 100 percent of the active truckload fleet in the U.S., upward pressure on rates could well be the result, provided the wider economy doesn’t take a significant dive. Perry noted the upward utilization forecast shown here is the projected result of the effect of a bevy of regulatory items coming into play at once, including the Federal Motor Carrier Safety Administration’s electronic logging device mandate at the end of 2017, the establishment of the drug and alcohol clearinghouse database, and potentially a mandate for speed limiters. “The only portion of the industry that objects to [those items] is the small fleets and the owner-operators,” Perry added. Unlike with the hours of service and CSA changes mandated by Congress in recent times, he expected small fleets and independents in these cases not to be joined by larger fleets. FMCSA, he added, may thus be less likely to “get a lot of resistance.”