Previously in this series: Some pain amidst the gains — CSA’s Data Trail after the e-log shift
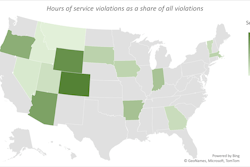
Though hours violation totals nationally have been falling for years, the chart below shows the extent to which more individual state truck enforcement departments are putting their attention in a big way on hours and associated ELD mandate violations.
 (Click through the image for a larger view.) *The 2018 total is a projection based on the first four months. It includes ELD- and AOBRD-related violations, as do previous years’ totals, where applicable. All contribute to scores in CSA’s Hours of Service Compliance category.
Percentages show hours violations as a share of the state’s total number of violations written. (Not shown in the chart is year 2013, when just four states had hours-violation percentages above 20 percent.) Based on the first four months of 2018, 12 state enforcement departments are showing hours violation percentages above the 20 percent line. In part, that’s a result of the plethora of ELD-mandate-related violations encoded but not counted toward carrier CSA scores prior to April 1, but also an indicator that ELD systems have given inspectors new things to find wrong with carrier operations.
Having a functional ELD on board, if you’re required to use one under the rules, has never been more important in this respect. That’s particularly true in states high in the hours violation rankings, an indication of inspectors’ close focus on hours and, now, ELDs.

Next in this series: More leeway to report a malfunctioning ELD