While national average spot truckload prices considered for all segments in aggregate held steady during a short Thanksgiving week, van rates increased on nearly every major lane in the country, notes DAT Solutions, which operates the DAT network of load boards.
The “Black Friday” after Thanksgiving once marked the end of the retail-freight season, but last week showed how e-commerce is extending the holiday push. Rates on the 100 highest-volume van lanes rose an average of 2.3 percent, or 5 cents per mile, during the week ending Nov. 24, with 78 of those lanes moving higher, only 17 declining. The big gains were on lanes closely tied to retail.
The national average spot rate for refrigerated freight was unchanged, while the flatbed rate continued a seasonal decline.
National Average Spot Truckload Rates
**Van: $2.07/mile, down 1 cent compared to the previous week
**Reefer: $2.47/mile, unchanged
**Flatbed: $2.40/mile, down 1 cent
National Average Load-to-Truck Ratios
The number of trucks posted to DAT load boards increased 4.4 percent versus a 1 percent gain in the number of available loads last week. Average load-to-truck ratios:
**Van: 6.4 loads per truck
**Reefer: 6.2 loads per truck
**Flatbed: 15.9 loads per truck
Trend to Watch: Van demand
Van load posts on DAT load boards declined 12 percent while truck posts fell 28 percent last week, which included the Thanksgiving holiday (a 20 to 25 percent fall is typical for both). Outbound pricing reflected higher demand, including from Buffalo ($2.78/mile, up 19 cents); Charlotte ($2.39/mile, up 9 cents); Atlanta ($2.25/mile, up 5 cents); Houston ($1.84/mile, up 4 cents); Chicago ($2.57/mile, up 9 cents); and Columbus, Ohio ($2.51/mile, up 9 cents).
Market to Watch: Allentown, Pa.
Allentown is gaining traction as a freight distribution hub. It’s roughly 60 miles from Philadelphia, 100 miles from metropolitan New York, and 80 miles from the ports at Newark, N.J., making it accessible for a deep pool of carriers.
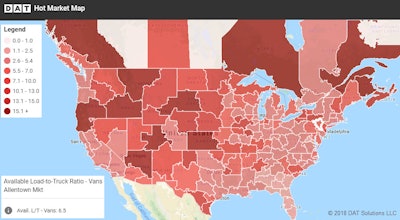 The most recent Hot Market Map (Nov. 28) shows an outbound load-to-truck ratio of 6.5 for dry van out of Allentown, and there were more van loads posted for Allentown than either Philly or Baltimore. Last week, rates rose on lanes originating in Allentown but also on freight being delivered there, based on computations within DAT’s RateView product.
Here are two examples of average rates on key lane pairs, with Allentown as origin and destination.
308-mile length of haul, heading northeast:
**Allentown to Boston: $3.96/mile, up 19 cents
**Boston to Allentown: $2.14/mile, up 1 cent
400-mile length of haul, heading west
**Allentown to Cleveland: $1.82/mile, down 1 cent
**Cleveland to Allentown: $3.59/mile, up 10 cents
While a rise in inbound and outbound rates was a trend for most van markets last week, Allentown was exceptionally busy. It’s a market to watch as we move into December.

