Truckload volumes bounced back after Thanksgiving — the number of available loads increased 93% week over week to close out last week, ending Dec. 6. That’s according to DAT Freight & Analytics, which operates the DAT online marketplace for spot truckload freight.
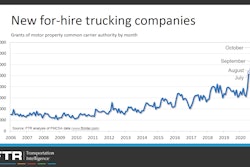
Such big swings are typical for comparisons of a full workweek to a reduced one. But more telling is that there’s nearly double the number of available loads on the DAT load board network compared to this time last year. The number of truck posts, meanwhile, is down 9.7% year over year.

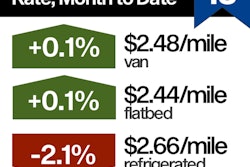
While spot rates have been setting records, there are signs that pricing is beginning to soften for the first time in more than seven months.
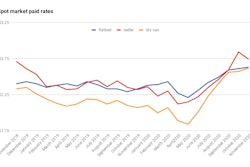
National average rates, December through the 6th
Spot rates held up well last week compared to the November averages:
**Van: $2.52 per mile, 8 cents higher than November
**Reefer: $2.71 per mile, 2 cents more than November
**Flatbed: $2.43 per mile, the same
Some trends to watch
Post-Thanksgiving lull for reefers
Rates and load movement dipped on DAT’s top 72 reefer lanes by volume. The average rate as of Dec. 6 was higher on just 17 lanes, 54 lanes were down, and one was unchanged. Volumes on these lanes decreased 11% compared to the previous week, a sign that the reefer market may have hit the peak expected around Thanksgiving.

The national average reefer load-to-truck ratio increased to 9.0, up from 6.3 the previous week.
Load-to-truck ratios represent the number of loads for every truck posted on DAT load boards. Changes often signal impending changes in rates.
On a year-over-year basis, reefer load post volumes are up 53%. However, the total volume of reefer freight is lower year over year, largely because of the depressed food services sector. According to last week’s U.S. Dept. of Agriculture data, domestic loads of produce (which account for 53% of total produce volume) are down 18% year over year.
Van movements reflect retail changes
Dry van load postings spiked to a five-year high last week, up 21% compared to the weekly average for the prior two months. At the same time, 8% fewer trucks were posted compared to the weekly average for all of October and November.
The national average van load-to-truck ratio was 5.9, up from 3.8 the previous week and well ahead of the November average of 4.5.
The number of loads moved on DAT’s top 100 van lanes by volume increased 6.7% compared to the previous week and the average outbound spot rate was higher on 53 of those lanes. Twenty-five lanes were neutral and 22 saw rates fall.
One surprise: Los Angeles and Ontario, California, have been among the top three van markets for volume during most of October and November but fell out of the top 10 last week. Capacity has been tight in southern California following the surge in imports on the transpacific shipping lane from Asia, driving up spot rates. But last week the supply/demand balance shifted and outbound rates fell in both markets.
Flatbed demand declines slightly
Of DAT’s top 78 flatbed markets, the average outbound rate was higher in 25, lower in 23, and neutral in 30 last week, and the number of loads moved in those markets declined by 3.6%. Rates in most high-volume markets have been flat over the last two weeks, though several stand out for their ups and downs since Nov. 20:
**Jacksonville, Florida: $2.64 a mile, up 20 cents
**Raleigh, North Carolina: $2.68, up 9 cents
**Rockford, Illinois: $3.19, down 12 cents
**Harrisburg, Pennsylvania: $3.64, down 9 cents
**Roanoke, Virginia: $3.18, down 9 cents
The flatbed load-to-truck ratio was 35.8 as a national average, up from 24.9 the previous week.