Larger fleets have long had the tools to track detention time, but with the spread of ELDs, fleets of all sizes can now document time spent at docks with great accuracy. Some ELD providers and their partners are aggregating ELD data to derive average dwell times at thousands of facilities and distributing the information to all their customers. This is the second in a two-part series. The first set of online stories making up the first part, about the “gold rush” for ELD data, begins at this link, in case you missed it.
For owner-operators already angered by the intrusive nature of the electronic logging device mandate, the growing awareness of their private ELD data being harvested for others’ financial benefit can seem like a further invasion of privacy.
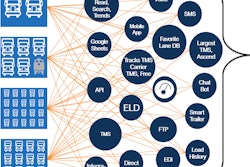
The secondary uses of the data, however, offer some positive returns through new or improved digital tools. ELD suppliers promise a new era of trucking in which location and hours of service tracking, whether in aggregate or individually, enhances efficiency and profits. This especially could be true for smaller carriers that lack the sophisticated telematics and data-gathering systems that larger carriers have long enjoyed.
At the same time, information is power, as the saying goes. With so much data being crunched by so many parties in so many ways, there are hints that new winners and losers will emerge as power shifts among carriers, brokers and shippers.
Reducing detention at the docks
One of the most potentially useful applications of ELD data is in the attempt to mitigate detention time by documenting it precisely.
Transflo, which serves mostly midsized fleets, is among ELD providers working toward that. By integrating its ELD product into its mix of workflow and document management products, Transflo believes fleets can better address detention with shippers, says Doug Schrier, vice president of product.

“Drivers know when they’re being detained,” says Schrier. “The thing they’ve struggled with is being able to prove it.”
On a broader scale, aggregated ELD data can enable a fleet to make better decisions in choosing loads by avoiding known times and locations of lengthy detention.
“When there’s transparency around every dock and what its detention performance is, it’s going to be a huge benefit to drivers,” says Daniel Pickett, a data analyst for FreightWaves’ Sonar platform. Today, the company doesn’t offer that granular level of detail about individual shippers and receivers. Its Sonar data analytics platform, though, now shows dwell times aggregated by region. The feature is built in part on access to carrier and ELD suppliers’ anonymized ELD data.
Drivers could glean whether opting for a 10 a.m. appointment instead of 8 a.m., or choosing a different weekday, could reduce their wait, Pickett says. “The difference can be very meaningful, in what we’ve studied,” he says. As Pickett suggests, anonymized, aggregated information thus can be retraced to an individual source by data-science teams within the ELD supplier in key ways to benefit those supplying the data.
Jon Gavrilyuk, technology/billing manager for the owner-operator-heavy hotshot fleet Safe Way Carrier of Springfield, Missouri, sees good potential for a new detention measurement feature from the carrier’s ELD supplier, KeepTruckin.
The company uses aggregated and anonymous carrier data to identify and analyze detention times at shipper/receiver sites. Being released this summer is KeepTruckin’s Facility Insights feature that Gavrilyuk likens to Yelp for evaluating dock efficiencies.
The tool, based on geofencing around docks, is free to users of the KeepTruckin ELD, whose historical location and time data underly the tool. Once a shipper or receiver reaches at least five visits by five different carriers, KeepTruckin adds the identified facility to its platform so its ELD customers can see its average times.
Detention or “dwell” time, the latter used sometimes to refer to the entire time spent at a facility, also is in the big-data crosshairs of a variety of third-party technology providers. These include load tracking/matching provider Trucker Tools and Truckstop.com with its partnership with the driver-friendly Dock411 app for multifaceted dock information.
Like KeepTruckin, ELD supplier Geotab, valuing users’ detention data, is looking for the “best way to infuse that within our ecosystem,” says Mike Branch, vice president for data and analytics. Without access to user trip data, he adds, such tools would not be possible. That’s part of the reason Geotab’s service agreement, like those of certain other ELD providers, requires users to consent to internal use of anonymous, aggregated data toward building new products.
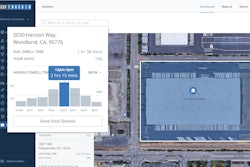
 Wait times at facilities in the El Paso, Texas, region along the U.S.-Mexico border were the highest in the nation with this snapshot taken in June from the Freightwaves Sonar platform for freight analytics. It’s excerpted from a chart that shows average dock wait times in minutes in 130-plus U.S. markets and the percentage change from the prior week. The full chart goes from the highest times in the upper left (El Paso) to the lowest, in the bottom right. The service depends in part on access to ELD data from carriers and ELD vendors.
First steps in carriers wielding their own data
For most owner-operators, detention times at shippers and receivers haven’t improved, at least since the ELD mandate came into play Dec. 18, 2017. Overdrive polling early this year showed more than 80 percent of respondents had either noticed no perceptible change in detention or said it had gotten worse.
Yet since the advent of location tracking, which pre-dates ELDs, detention has been monitored and tracked by larger carriers in various ways. One large-carrier example shows how this data, instead of simply just proving detention times, can be used to analyze its full cost.
Maverick Transportation, which runs 1,700 trucks, has created an internal cost analysis system to evaluate customers. President John Culp explained the system during a panel at the Truckload Carriers Association’s annual convention in March.
The system uses time, location and other data to measure direct and overhead costs such as loading, unloading and transit times to calculate an operating ratio for each load and customer by lane.
He noted one customer asked the Little Rock, Arkansas-based fleet to provide a data feed for the estimated arrival time of its shipments. It factors in traffic, scheduled or unscheduled maintenance events and ELD/telematics-derived data such as vehicle location and speed and the driver’s hours of service. —Aaron Huff contributed to this report.
Next in this series: More ELD data hopes and hazards: Load matching efficiency improvements