While more clean inspections overall may well be the reality for inspections recorded in the federal Motor Carrier Management and Information System database, Overdrive’s audience of mostly owner-operators is more skeptical.

November poll results showed a majority of readers noting inspectors continue to get more and more “nitpicky” on violations at roadside. Among those who felt clean inspections were in fact more likely today than five years ago, meanwhile, nearly half either hadn’t seen evidence of it or still felt there were plenty of jurisdictions remaining that didn’t finish the job enough.
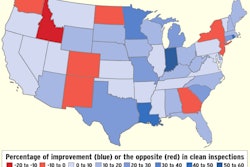
It’s true at least that more states are recording above-average violations per individual inspection than in previous years, though that is not exactly obvious when you consider the national average alone. Violations per inspection fell as a national average from 1.7 in 2015 to 1.5 in 2016, led in part by a boost in inspections in sizable states where violation-free inspections are most common (including inspection leaders Maryland and California, among others).

As the average fell slightly, a larger number of states ranked above the average than in prior years. In 2016, there are 21 states with above-average violations-per-inspection rates, three more than the 18 shown in 2015, as illustrated in the bar chart.

Next in this series: More clean inspections: Enforcement change or improved compliance?