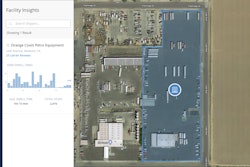
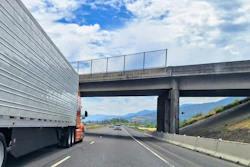
Uber Freight, whose freight-matching platform is geared toward small carriers and independent owner-operators, released Thursday its first Facility Insights Report, a collection of high-level conclusions based on drivers’ ratings of shippers and receivers.
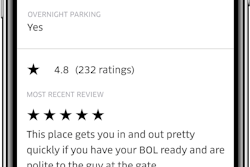
Of little surprise, the factor that weighed most heavily in drivers’ ratings of facilities was turn-around time at shippers or receivers, both in positive and negative reviews. In positive reviews, quick loading and unloading times were cited 89% of the time. In negative reviews, loading and unloading times were cited in 40% of the reviews, followed by friendliness of staff (26% of reviews) and facility conditions and amenities (18 %).
Like Uber’s ride-sharing service, Uber Freight allows drivers to rate those with whom they do business via a five-star rating program. Uber’s shipper customers have access to the ratings, as do drivers, who can use the ratings to determine whether they want to take a load from that shipper.
Uber says it has collected over 250,000 ratings from truckers since it launched its Uber Freight platform in 2017.
In its first Facility Insights Report, which Uber says it plans to publish regularly, it aggregated 145,000 reviews from January-April of this year.

The average rating for a load pickup facility was 4.32, and the average drop-off facility rating was 4.23. Pickup facilities scored higher during late night and early mornings, and drop-off facilities scored higher marks during the daytime — and vice versa.
Also of no surprise, drivers tend to book loads more quickly with shippers and receivers with higher star ratings. Per the report: “On average, for a 4-star facility, 18 Uber Freight app users view one load before it gets booked. But for a 5-star facility, only 9 app users view the same load before booked.”
Regionally, facilities in the Southwestern and Western U.S. scored the highest — 4.32 and 4.31 on average, respectively. Facilities in the Northeast received the lowest marks on average — 4.19. Midwest and Southeast facilities scored 4.29 and 4.24 respectively.
On a state-by-state basis, New Mexico’s facilities received the highest average at 4.71, followed by Maine’s 4.48, Washington’s 4.46 and Minnesota’s 4.46. On the flipside, Connecticut fared the worst, with its facilities ranking on average 4.02, followed by Maryland’s 4.06, Virginia’s 4.06 and New Jersey’s 4.12.
Broken down by load type, soft beverage shippers were rated the highest, with an average of 4.37, followed by hard beverages at 4.30. Food shippers were rated the worst, 4.17 on average.
“Ultimately, drivers care most about efficiency and respect for their service on the road,” Uber’s report states. “The best way for shippers to deliver a great experience and encourage drivers to return…is straightforward — improving the speed within their facilities.”