The ads call out to you from trucking magazines and websites: We pay 100 percent fuel surcharge! Free base plates! Paid loading/unloading! With so many carriers recruiting owner-operators and so many factors to consider within each pay package, it’s no wonder that many owner-operators have a tough time estimating potential revenue from advertised compensation packages.
While comparing pay packages is a time-consuming, often frustrating endeavor, the key is to start with an understanding of what you need to make each month to cover your expenses. Only then will you know whether a carrier’s pay package is a good deal for you. Figure your total cost-per-mile by adding fixed and variable costs for the year and dividing by 12 to get the average per month. Divide that number by average monthly miles to determine your cost per mile for a given month. This is what you need to make monthly just to break even.
Be sure to include non-revenue miles – such as deadhead or a trip to the shop – in your monthly estimate; those miles also cost money. If a company agrees to pay you a dollar per mile for deadhead but it costs you $1.10 to operate the truck, you’ll have to make up that lost 10 cents per mile elsewhere.
For some elements of a pay package such as detention pay, it’s also helpful to know your revenue per hour of driving. To determine this, multiply your per-mile rate by your average driving speed. For example:
Pay rate per mile $1.10
Average speed x 59 mph
GROSS REVENUE PER HOUR = $64.90
Knowing your hourly rate helps you determine whether the detention pay you’re offered adequately compensates you for the revenue you lose sitting on a load.
Use your break-even point and your hourly revenue estimate as you begin to gather information about pay packages. Ask carriers detailed questions about all revenue items and any cost items they cover. Chart those numbers on a spreadsheet, such as the one in this chapter, to begin your evaluation. To make your comparisons as accurate as possible, make sure you understand some of the more confusing aspects of pay packages:
LEARN HOW MILEAGE IS CALCULATED. If a carrier pays by the mile, ask which system is used. Short (also called household goods) miles give the shortest route, so they are the least desirable to an owner-operator. Practical route miles average 3 percent to 5 percent more. Hub miles average 3 percent to 5 percent more than practical route miles, but few carriers use that system.
A number of fleets have switched from short miles to practical miles, which amounts to an across-the-board raise. Practical miles systems use measurements based on actual addresses or ZIP codes and account for common-sense alternate routing. Fleets won’t pay drivers the practical rate unless they know their customers will pay the practical rate as well. Ask a prospective fleet whether its rate paid to drivers matches its rate charged to customers. Also ask what routing system the fleet uses. You can run your own comparisons with programs such as Rand McNally’s Milemaker, Prophesy Mileage and Routing (www.mile.com), Promiles (www.promiles.com) or ALK’s PC-Miler (www.pcmiler.com).
Some fleets also offer mileage pay that varies according to the length of the haul – generally more per mile for shorter hauls – changes that have been fairly rapid in recent history, industry experts agree. Ask prospective carriers about their particular mileage variations.
LEARN HOW PERCENTAGE OF REVENUE IS CALCULATED. If a carrier pays by percentage, understand the calculations. Some carriers may pay 78 percent of 100 percent of the revenue. Others pay 78 percent of 96 percent of the revenue, or 90 percent of 100 percent with added cost responsibility for the operators. Such distinctions can account for hundreds of dollars’ difference over 10,000 miles.
LEARN THE POLICY AND PRACTICE OF FUEL SURCHARGES. Find out exactly how the surcharge is computed and whether it compensates for all or only part of rising diesel prices. The best-case scenario is a carrier that bills surcharges to all clients and pays all surcharges to the owner-operator. If the carrier pays only on collection, ask for the average amount passed on to owner-operators, and use that number to make your comparison.
LEARN THE REAL COST OF ANY CO-OP PROGRAM. If you plan to make use of a carrier’s cooperative buying program, ask what the markup is on things such as tires. Ask how quickly the purchase has to be repaid. Make sure you’re getting a good deal. Some carriers with fuel programs charge owner-operators $1 to $3 every time they use the card, which can add up to hundreds of dollars per year. On the flipside, buying fuel at a cheaper rate could more than make up for those fees. Crunch the numbers to find out.
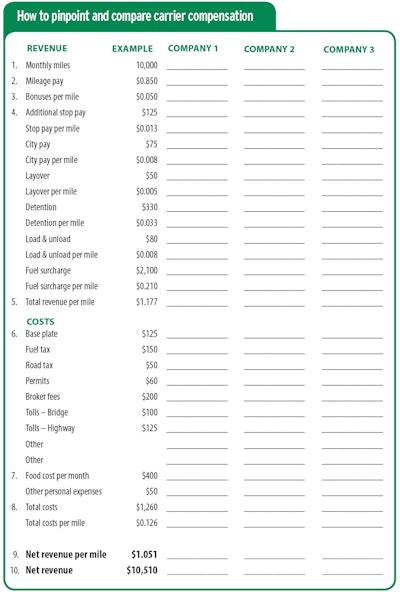
HOW TO PINPOINT AND COMPARE CARRIER COMPENSATION
Use the spreadsheet in this chapter to compare carrier compensation packages.
REVENUE
- Estimate the monthly miles you will run based on your available time and the carrier’s promises.
- Put in the carrier’s advertised mileage pay. If the carrier pays on percentage of revenue, ask for an average rate per mile that its owner-operators make based on percentage.
- List any per-mile bonuses or variations per length of haul.
- List all of the elements a carrier includes in its pay package, such as stop pay, city pay, layover, detention, load and unload. Divide each by your miles per month to determine its per-mile basis.
Example:
$125 stop pay ÷ 10,000 miles = $0.0125 PER MILE FOR STOP PAY.
- Add all the per-mile elements to the mileage pay to determine your total revenue per mile.
COSTS
- Estimate monthly costs that either you or the carrier will cover – fuel tax, permits, tolls, etc. When a carrier covers a particular cost, such as tolls, leave that line blank. For an annual expense such as base plate, divide by 12 to get the pro-rated cost.
- If you’re comparing local or regional operations with long haul, also estimate monthly costs for food and other personal road expenses, which will vary depending on how many days you’re away from home.
- Add the cost elements and divide by your monthly mileage to determine cost per mile.
- Subtract the cost per mile from total revenue per mile to determine your pay per mile. Example:
$1.010 total revenue per mile – $0.726 cost per mile = $0.284 NET REVENUE PER MILE
- Calculate your monthly net revenue for that carrier by multiplying your net revenue per mile pay by your monthly miles. For example:
$0.284 per mile x 10,000 miles per month = $2,840 REVENUE PER MONTH
Once you have run revenue and cost comparisons for all carriers you’re considering, look at the factors that are tough to assign a dollar amount to, such as home time, rider and pet policies, and availability of dedicated runs. Only then can you make an informed decision that meets your business and personal needs.
Percentage versus mileage pay
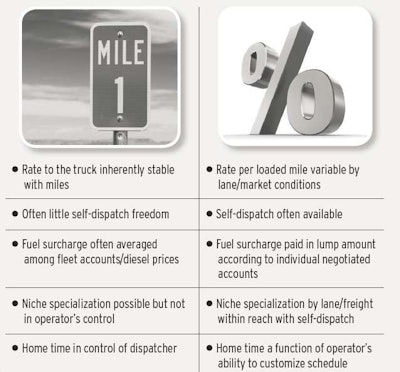
Today, several carriers have bucked tradition by offering owner-operators a choice of pay package, typically between a company-dispatched mileage-pay program and a percentage-pay program in which owner-operator self-dispatch offers great operational latitude. Understanding the advantages of each is key to making the choice.
An owner-operator running on percentage shares the brunt of market conditions with the carrier, earning less money in bad times, whereas a mileage program in such times is an attractive safety net. In an environment with rates rising steadily, operators on a percentage program can benefit with a sort of built-in pay raise without running more miles.
Operators who excel in percentage pay shift their focus from weekly mileage targets to revenue targets, ideally achieved on the fewest possible miles.
Here’s a basic breakdown of each system’s characteristics:
