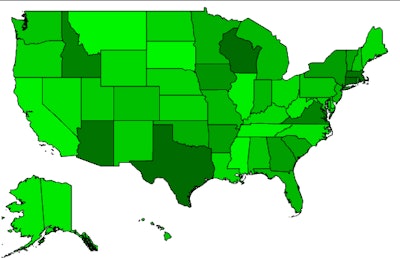
2016 clean inspections percentage; National average — 45.8%
The heat map above illustrates in the darker blue areas the states where no-violation inspections account for the highest percentages of the state’s overall inspections. The national average noted at top — just under 46 percent of all inspections recorded in the states in 2016 were totally clean inspections — has been growing over the years we’ve been tracking inspection statistics in the CSA’s Data Trail series.
Since year 2012, when the violation-free inspection percentage was below 40 percent, while the total number of inspections has remained relatively level and even fallen a little, violation-free inspection numbers have grown considerably, by more than 18 percent, or almost a full fifth over 2012 levels. The trend really began to accelerate in 2015 and 2016, after creeping along with only slight change in the years prior. If it has kept up this year, we may well see an overall majority of inspections result in no violations next year. While some point to the CSA program putting more motor carrier focus on ticky-tacky vehicle and other compliance issues, clean inspection levels perhaps ironically reached their highest levels in the first full year after CSA scores were thrown behind the curtain, away from public view, in December 2015. (Clean inspections generally contribute positively to carriers’ numerical rankings, or “scores,” in the CSA SMS.)

CVSA Executive Director Colin Mooney also points, however, to an ongoing effort among state enforcement departments to improve the data quality within the CSA system by finishing what they started, as we’ve reported before, which could easily have assumed greater importance after some of the public-use teeth were pulled from CSA.
And while more clean inspections overall may well be the reality for inspections recorded in the federal Motor Carrier Management and Information System database, road reality as perceived by Overdrive‘s audience stands at odds with the contention that things are improving. Vote in the poll below or click “view results” for the latest in answer to a question aimed at sussing out your firsthand experience of inspections over the last five years.


As of the afternoon of Thursday, November 2, around a quarter of operators noted they believed clean inspections were going up, but just 13 percent of the total number of poll respondents said they’d seen evidence of it in their operation. A majority of readers saw more of that nit-picky enforcement so many know well rather than clean inspections.
It turns out there’s some evidence of that, too, in analysis of another metric — one that shows the per-inspection intensity in some violation-heavy states.
2016 violations per inspection; National average — 1.5
Darker areas in this map (roll-over or tap the state to see its 2016 violations-per-individual inspection average) show states that recorded the most violations for any individual inspection on average in 2016. The national average is not off quite as much as the clean inspections percentage is up, though it did decline by almost 12 percent from its full-year 2015 level.
In any case, what’s been your most recent inspection experience — good or bad? Drop a note in the comments or send me a message directly at tdills [at] randallreilly.com. I’m working on an update on trends in inspections for the December issue — what are you seeing?
 Alternately, weigh in via our podcast voicemail line. If you’re reading on a smartphone, tap the image to call and leave us a message to weigh in with your story. If you’re on a desktop, call 530-408-6423. Make sure to tell us your name and state of residence.
All numbers in this story come from federal data analyzed by Overdrive and its sister company RigDig Business Intelligence.