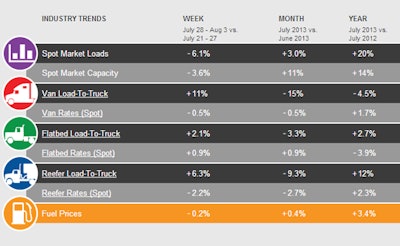
DAT’s Trendlines weekly report looked back at total load volume for the months of June and July and saw for the first time since 1996, when DAT began tracking monthly stats spot market load volume for July topped volume in June. Loads were up 3 percent for the month, compared to a 20 percent average decline from June to July in the past 10 years. Van and reefer rates slipped seasonally, and flatbed rates rose as a national average. Click through the image below for the full Trendlines report for the week ending Aug. 3, 2013.

 Find more detail from the IANA quarterly reports via this link.
Intermodal
Domestic container volume continues to be the hottest segment in all intermodal movement in terms of growth. The Intermodal Association of North America’s quarterly “Intermodal market trends and statistics” report saw domestic container volume continue steady performance in the second quarter of 2013, with 9 percent year-over-year gains, largely attributable to a strong big-box segment, with total intermodal traffic rising by 2.4 percent for the quarter.
Regional Southeast traffic was particularly strong, growing 8.1 percent year over year in the second quarter — domestic container volume lead the way, up 12.4 percent, surpassing the industry average of 9 percent growth. Southeast international intermodal also bested industry statistics with a 6.7 percent gain compared to a 1.3 percent drop nationwide.

International volume, however, fell 1.3 percent in the second quarter after posting 3 percent gains in the first. This decline can be attributed to surprisingly weak shipments in June, with loads falling 6 percent from a year ago.
Intermodal trailer volumes declined 2.5 percent year over year, but this loss was less than half of the decrease in loads experienced in Q1.


