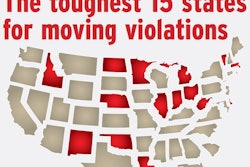

All seven of the states mapped above show speeding among the top six violation priorities in the state. All but Ohio are a top 20 state in our moving violations intensity rankings (see the charted list below for the full list — percentages correspond to that state’s moving violations’ share of all violations issued).
 Catch more in-depth state-by-state data and analysis via our CSA’s Data Trail main page, recently updated to reflect year 2014 data.
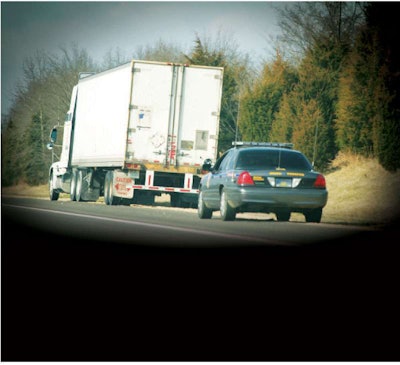
Trucks are under particular scrutiny while on the highway in these states, which devote considerable resources to mobile enforcement. The best way to avoid being placed under the enforcement microscope there might well be to keep off the accelerator.
Of the seven states, the two at the east-west extremes (West Virginia and Nebraska) are far down the rankings in inspection intensity, meaning your odds of getting inspected during a roadside stop there are low. But if you are, the likelihood that speeding was the reason you were stopped is relatively high.
Explore each state’s inspection rankings and violation priorities in the data below, and you can download detailed information for all 48 continental U.S. state via Overdrive‘s CSA’s Data Trail main hub.
West Virginia
Inspection intensity rank: No. 42
Violations per inspection: 1.1
Clean inspections – 53%
VIOLATION PRIORITIES
Lights – 23.6%
Observed vehicle defects – 16.4%
Brakes – 9.9%
Tires – 6.9%
Hours – 6%
Speeding – 5.9%
Ohio
| TOP 20 TOUGHEST STATES FOR MOVING VIOLATIONS |
Inspection intensity rank: No. 26
Violations per inspection: 1.8
Clean inspections – 35.5%
VIOLATION PRIORITIES
Lights – 33.5%
Brakes – 19.8%
Observed vehicle defects – 8.5%
Tires – 7.8%
Hours – 7%
Speeding – 3.7%
Indiana
Inspection intensity rank: No. 9
Violations per inspection: 1.8
Clean inspections – 17.3%
VIOLATION PRIORITIES
Hours – 18.7%
Speeding – 17.4%
Lights – 9.3%
Brakes – 8.5%
Observed vehicle defects – 8.4%
Lack of periodic inspection – 3%
Michigan
Inspection intensity rank: No. 13
Violations per inspection: 1.8
Clean inspections – 19%
VIOLATION PRIORITIES
Lights – 17.4%
Observed vehicle defects – 15.6%
Brakes – 13.4%
Speeding – 9%
Hours – 6.2%
Tires – 3.1%
Illinois
Inspection intensity rank: No. 7
Violations per inspection: 1.1
Clean inspections – 47.7%
VIOLATION PRIORITIES
Lights – 12.4%
Brakes – 11.1%
Speeding – 11.1%
Hours – 8.9%
Observed vehicle defects – 8.2%
Improper lane change – 6.6%
Iowa
Inspection intensity rank: No. 18
Violations per inspection: 2.1
Clean inspections – 23.6%
VIOLATION PRIORITIES
Hours – 18.1%
Lights – 16.7%
Observed vehicle defects – 14.7%
Brakes – 9.9%
Lack of periodic inspection – 5.2%
Speeding – 4.5%
Nebraska
Inspection intensity rank: No. 45
Violations per inspection: 1.5
Clean inspections – 47.6%
Find data for all 48 continental U.S. states and maps ranking states according to inspection intensity and violation priorities at the CSA’s Data Trail main hub.
VIOLATION PRIORITIES
Brakes – 15.8%
Observed vehicle defects – 13.3%
Lights – 10.8%
Hours – 9.9%
Lack of periodic inspection – 7.1%
Speeding – 6.3%

