Since commenting last week on the generally “soft” nature of van freight volume for this time of year, coupled with generally low demand on DAT Load Boards for trucks pulling dry vans, DAT’s Ken Harper looked back at volume over years since 2011. Activity in van, the most predominant segment on the board, this year well exceeds all those prior years, with one exception: 2014 was a “record-setting year,” he says, on the spot market, as regular readers will well know.
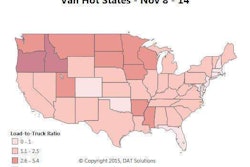
Last week, van load availability continued to fall (by 3.9 percent) week over week, and demand followed — the national van load-to-truck ratio further declined from 1.4 to 1.3 loads per truck. However, the Northwestern markets of Medford, Ore.; Twin Falls, Idaho; and Missoula, Mont., continued to generate high demand, and a relative shortage of trucks made it easy to find loads.
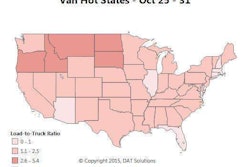
The Hot States Map above, for the week of Oct. 18-24, also shows favorable load-to-truck ratios in the Dakotas, but freight volume there is more moderate, DAT says.
Nonetheless, Harper notes, 2015 volume for van — as well as flatbed and reefer — does show year-over-year growth compared to 2013 and prior years. Earlier this summer, there was a round of what American Trucking Associations economist Bob Costello and other analysts, quoted in a Journal of Commerce story accessible via this link, saw as an outsize buildup of retail inventories that didn’t bode well for the season we’re in now.

The question, Harper says, remains as to “whether retail shippers got their goods, usually from the Pacific Rim, early this year, or if a shift in distribution caused by e-commerce has changed the ‘second season'” dynamics, traditionally presaging the holiday retail season, for good.
 Despite the slight demand decline, spot market rates held steady — and low — for vans last week, at a national average of $1.72 per mile. Outbound rates trended up in Los Angeles, but declined in Dallas, Chicago and Atlanta. Rate trends out of Philadelphia were mixed.
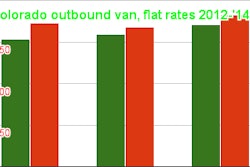
A bright local spot for freight availability, which increased in several Midwestern states, as well as outbound rates was Minneapolis. On average, dry van haulers were getting $2.63 per mile outbound to Denver – but the return trip showed an average, dreaded “buck-a-mile backhaul” for more than 900 miles. To improve on that, consider breaking up the return trip with a load to Rapid City, S.D.
That lane paid $1.62 per mile last week. A second load from Rapid City back to Minneapolis paid $1.22 per mile. Sounds terrible, but the extra leg, if you can do it without adding a day to the trip, will pay off in almost $400 in revenue to the roundtrip with only 70 extra miles of driving. Examine the details in the chart below.