Total inspections in 2015 across the nation reversed a downward trend noted with last year’s CSA’s Data Trail series by rising slightly less than a percentage point to 3,093,835. At the state level, however, more variation was evident, particularly when adjusted for intensity.
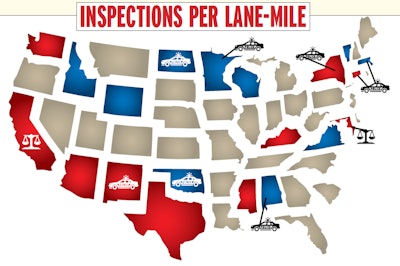
 The total number of state-conducted inspections divided by the number of lane-miles of National Highway System in the state’s borders yields these rankings. The police car symbol in this chart indicates states where enforcement is tilted heavily toward the roadside, with more than 60 percent of inspections conducted as the result of a stop. Scale symbols indicate states in which more than 60 percent of inspections are conducted at a fixed location such as a weigh station. Data comes from 2015-conducted inspections reported to the federal system and mined by Overdrive and and RigDig Business Intelligence (excluding Alaska, Hawaii and the District of Columbia).
To see each state’s violation priorities and inspection intensity rankings, among other metrics, view the interactive maps above and below and via the CSA’s Data Trail main hub. There you also can download a report ranking all 48 continental states by intensity of focus on various violation categories, violations per inspection, clean inspections and more.