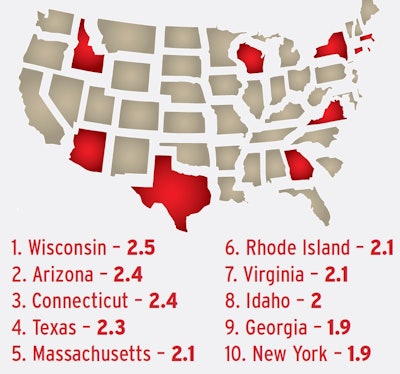
2017 violations per inspection rankings
 Source: Calendar year 2017 federal data from the MCMIS database analyzed by Overdrive and RigDig Business Intelligence. Click here for more data.
Taking states prone to issuing the most violations per individual inspection (as shown above), then ranking those by inspection volume, only Georgia comes close to matching the more than 108,000 inspections performed by New York, or the more than 500,000 performed by Texas officials, in 2017. Georgia’s 87,000 inspections, however, weren’t enough to put that state even in the top half of those ranked for inspection intensity (inspections per lane-mile).
New York, meanwhile, with this year’s CSA’s Data Trail update, sits at No. 13 in that metric. Its inspection violation intensity from 2014 through 2017 has been at 1.8 or 1.9, 2017’s level.
More on the inspection/violation lay of the land in the Empire State:


