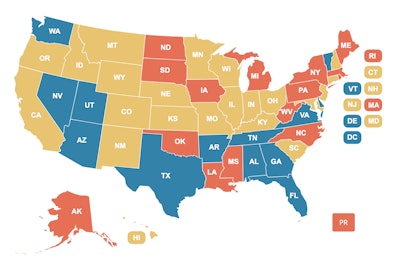
 States in red have more than 9 percent of their bridges on the “structurally deficient” list, while states in blue have less than 5 percent of their bridges on the list. States in yellow have between 5 and 9 percent of their bridges on the list.
More than 47,000 bridges in the United States are rated “structurally deficient” and need urgent repairs, according to the annual bridge report from the American Road and Transportation Builders Association.
ARTBA reports that at the current pace of bridge improvement, it would take more than 80 years to make the repairs needed on the 47,052 structurally deficient bridges.
Additionally, including the structurally deficient bridges, there are nearly 235,000 bridges across the country (38 percent of all bridges) that are in need of structural repair, rehabilitation or replacement.
ARTBA says that between 2017 and 2018, there were 5,660 bridges classified as structurally deficient that had not previously been on the list with another 6,229 bridges that were structurally deficient in 2017 that were removed from the list in 2018. The net decline of 567 bridges deemed structurally deficient is the slowest in five years, the group says, as the number of structurally deficient bridges fell by an average of 1,700 per year between 2014 and 2017.
Notable bridges on the list in 2018 include:
- New York’s Brooklyn Bridge
- Memorial Bridge connecting Washington, D.C., at the Lincoln Memorial with Arlington, Virginia
- San Mateo-Hayward Bridge crossing San Francisco Bay
- Robert S. Maestri Bridge over Lake Pontchartrain in Louisiana
The states with the most structurally deficient bridges, as a percentage of their total number of bridges, are: Rhode Island (23 percent), West Virginia (19.8 percent), Iowa (19.3 percent), South Dakota (16.7 percent) and Pennsylvania (16.5 percent).

Iowa leads the way in total number of bridges on the list with 4,675 bridges, followed by Pennsylvania with 3,770, Oklahoma with 2,540 and Illinois with 2,273.
ARTBA says these bridges may not be imminently unsafe, but they are in need of attention. The group says there are nearly 69,000 bridges across the country that are “posted for load,” meaning there are weight restrictions or other measures in place to reduce stress on the bridge.

