Demand for trucks lifted spot truckload freight volumes and rates to monthly highs in the last week of August, said DAT Solutions, which operates the DAT network of load boards. The number of van, reefer, and flatbed loads posted from August 26 to Sept. 1 increased 7% compared to the previous week, while truck posting activity dipped 2.4% heading into Labor Day weekend.
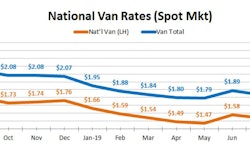
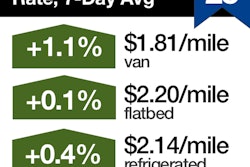
 This reporting period for September, shown above, includes just one day of activity—Sunday, Sept. 1, the day prior to Labor Day—yet it shows how much higher spot rates jumped to start the month compared to the August averages, which follow:
National average spot rates for the month of August
**Van: $1.81 per mile, 3 cents lower than the July average
**Flatbed: $2.20 per mile, 7 cents lower than July
**Reefer: $2.15 per mile, 5 cents lower than July
Trend to watch: Can van freight keep it up?
The van load-to-truck ratio hit 3.0 as a national average on Wednesday, August 28. That’s a strong number, considering that van rates tend to follow with a rise when the ratio exceeds 2.5, where the average settled for the week. Hurricane Dorian’s effects on supply chains came late in the week and had little impact on average rates, which rose on 73 of DAT’s Top 100 van lanes by volume. Seventeen lanes declined and 10 were neutral compared to the previous week.
 This van Hot Market Map shows van load/truck ratios inbound before Dorian was forecast to hit Florida as a major hurricane. The darker areas indicate more loads relative to the number of available trucks. The following map, conversely, shows what happened to those metrics in the aftermath as truckers and emergency logistics planners began to prep for the aftermath.
What does the first full week of the month have in store? Two things make the numbers harder to predict: the hurricane has been tricky to forecast, which makes supply-chain planning a challenge; and the Labor Day holiday, which will pull a day’s worth of volume and capacity out of the marketplace.

Market to watch: Washington state apples
The national reefer load-to-truck ratio rose from 4.4 to 4.8 last week on the strength of tree-fruit harvests in the Pacific Northwest and Upper Midwest. Load-to-truck ratios jumped sharply in the Pendleton market (Yakima, Wash.) and hit 23 on Friday, August 30. Spokane, Wash., which includes apple-rich Wenatchee, topped 34. The numbers are even more stark at the ZIP code level: 988XX—Wenatchee—had 544 loads posted and just five trucks, while 989XX—Yakima—had 851 loads posted and 56 available trucks.
Finally, if you have resources to offer during hurricane recovery efforts, consider reaching out to the American Logistics Aid Network. ALAN is a volunteer nonprofit organization with a web portal where freight brokers, warehouses, and truck fleets can post available resources and aid organizations can post their needs. You can learn more at their website.