Truckload rates on the spot market have seen better days, as we know. After a good year in 2014 and into part of 2015, fuel prices began to take their bite out of rates in a big way last year, and with the lackluster freight volumes that then followed for a variety of directly- and not-so-directly-related reasons, demand for trucking has fallen across all three segments.
The beginning of this year saw percentage declines in all three major segments over 2015 averages for loads originating in almost every one of the 48 continental states, on average. We charted just how much things have fallen, in percentage terms, looking at Truckstop.com’s paid rates dataset, comprised of rates paid to carriers on actual loads. The maps below show the percentage that rates in each segment originating in each state has fallen for the first three and a half months of the year, versus the entirety of 2015.
While winter doldrums for rates are in some senses normal, the spring freight season has been a little late in coming this year and rather muted in its effect on rates. The good news is, in both the DAT Load Board network (see this last weekly report showing some rate upward movement with volume) and via Truckstop.com (rates were on the rise, finally, in April, after a long period of decline).

Surveyed in April about the biggest issues owner-operators are having with their businesses, rates was named as among the three top issues by 6 in 10 survey respondents, more than any other choice. Given demand/rate dynamics over the past year, that’s no surprise. Here’s what the year’s looked like so far. Hover your cursor over — or tap — each state on each map to see this year’s average rate decline (negative numbers) or boost (positive numbers) figured as a percentage of the 2015 average.
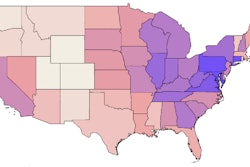
Dry van: Average fall — -13%
Nationally, spot market van paid rates are down more than 10 percent this year, and leading that fall were states in the Northeast — Delaware, Rhode Island and Connecticut, namely — in addition to some that arguably had the most to lose. This time last year, our Rates Hall of Fame showed the top performing load-origin states for the good year that was 2014 on the spot market. That list included Tennessee (No. 1) and Georgia (No. 4), both of which declined considerably in 2015 and continued to do so in the first quarter this year, posting near 16 percent falls.
Three load-origin states did show single-digit positive rate growth in the first quarter this year, evident in the darkest-shaded areas on the heat map below. Two were the fairly low-volume states of Montana and South Dakota, but West Coast Washington State led the list with a +2.2 percent boost over 2015.
Van 2016 v. 2015 — percentage decline so far this year
Flatbed: Average fall — -10.1%
Flatbed rates have fared best in percentage terms so far this year on a national basis, compared to an arguably miserable 2015 with the fall-off in volumes of platform freight headed to oil and gas operations as the price of crude fell to “oil bust” levels and drilling operations halted on a grand scale, as has been well-documented. Unlike in van and reefer, however, there are no load-origin states where positive rate growth has been seen this year for flatbed, only relatively small declines. The smallest falls (from -5 to -7 percent), as evidenced in darker-shaded areas of the map below, have been for loads originating in South Carolina, South Dakota, Montana, Nebraska, Missouri, New Jersey and Kansas.
Flatbed 2016 v. 2015 — percentage decline
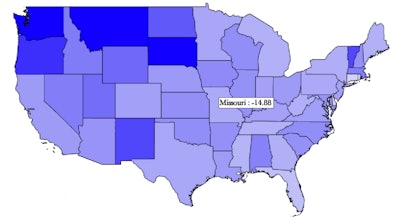
Reefer: Average fall — -14.8%
On average, the first quarter of 2016 hit reefer rates the hardest, in some sense no surprise given the winter season. Reefer paid rates have shown positive growth this year so far versus 2015 only on the small volume of loads originating in Vermont, where rates are up just a single percentage point versus 2015. Otherwise, as you can see in the map below, darker-shaded states represent where rates have shown the most stability, in Maryland and New Hampshire falling just a couple percentage points. States where the percentage fall-off has been in the single digits include Iowa, Kansas, North Dakota, Oklahoma, Utah and West Virginia. Otherwise, 10 percent-plus declines have been the norm.
Reefer 2016 v. 2015 — percentage decline