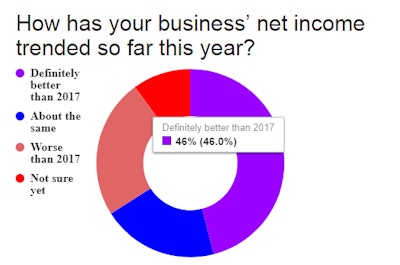
How has your business’ net income trended so far this year?
We asked the poll question above a couple weeks ago, and these results are as of this morning, showing what I think is a somewhat significant result for the owner-operators that make up Overdrive‘s audience. There’s a certain amount of feast or famine when it comes to market gains thus far this year, with the largest share of responding owner-ops well able to take advantage of such gains — as shown, close to half of respondents reported doing better at the bottom line so far in 2018, versus last year.
 Feast, famine or somewhere in between, how’s business for you so far this year? If you’re reading on a smartphone, tap the image to call and weigh in with a message on our podcast line. If you’re on a desktop, call 530-408-6423. Make sure to tell us your name and state of residence.
The second largest share of respondents, however, reported the opposite: Almost a quarter of readers were doing worse thus far this year.
A similar feast-or-famine aspect was on offer in our recent compensation survey, in which leased and independent owner-operator respondents, considered together, report business income in numbers tilted toward upper and lower ends of the spectrum.
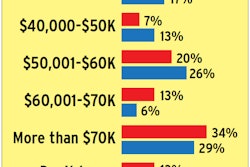
Net income in 2017 for leased and independent owner-operators
Again, the largest shares are represented by those who selected more than $70K or less than $40K — big equipment investments incurred in a single year, and the increasingly high cost of those investments, might account for some of the lower-end respondents. At once, it’s tempting to read more into it. A larger share of leased respondents, as a general rule more apt to offload business responsibility onto a third-party partner and perhaps less apt to take risks to enhance profitability than independents, reported income below $40K annually (22 percent). Among independents with authority, that share was just 17 percent, with 6 in 10 reporting income above $50K (among leased owner-ops, just 5 in 10 reported being above $50K).

At once, compare the above graph with results of a similar question asked of company drivers among survey respondents about gross pay, which shows greater distribution of income across the middle ranges — with less risk comes lesser reward as a general rule, but also less opportunity for the opposite, huge losses, to occur.
Company driver self-reported gross pay in 2017
 Only 1 in 5 company drivers reported earning more than $70K in 2017, compared to a third of both leased and independent owner-operators. Only 12 percent, however, earned less than $40K as company employees — percentages were higher in that category for both leased and independent owner-ops.
There’s no doubt some are making bank in today’s market. For evidence, look no farther than my post last week, in which a broker used the “price gouging” phrase to describe some rate demands from carriers the broker had experienced. Some niche performance is better than others, though. From an income perspective, where are owner-ops most able to take advantage of the feast dynamics of today’s market?
ATBS’ first-quarter average income numbers, reported yesterday by my colleague James Jaillet, showed continued gains led by flatbed operators, with reefer owner-ops experiencing the smallest gains among the major segments. Flatbed operators among ATBS clients were on track to earn nearly $70K on average ($69,312 to be exact) if second through fourth quarters matched Q1 performance.
Across the entire universe of owner-ops among ATBS clientele, recent years have seen average annual income hover around $60K.
Despite strong performance of ATBS clients, flatbedders among Overdrive‘s survey respondents represented the smallest share among major segments reporting income above the average:
Percentages of owner-ops reporting greater-than-average ($60K) income in 2017, by trailer type
In the end, the income waters are muddy, for sure. Where’s the money out there? So much depends on who you ask — and who you are. All the bedrock business basics still apply. Know your costs, determine your profit target sufficient to pay yourself well and support your family, and you’ll know just how much revenue you’ll need to get there.