Previously in this series: More leeway to report a malfunctioning ELD

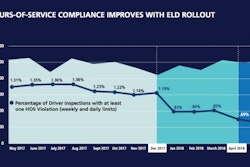
One piece of good news from 2017’s enforcement trends is that most of the rise in inspections was due to increased clean inspections, continuing a trend identified in last year’s update in the CSA’s Data Trail series.
There were 172,938 more clean inspections of for-hire carriers’ trucks in 2017 than in 2016. Or, to count inspections that weren’t clean: About 100,000 fewer roadside or fixed-location inspections in 2017 contained a violation.
In 2017, total heavy-duty truck and driver inspection numbers counted by Overdrive sister company RigDig Business Intelligence (RigDigBI.com) rose by more than 70,000 to 3,336,231 inspections. That 2.2 percent rise is about half the pace seen between 2015 and 2016, when Overdrive and RigDig documented a larger rise after years of overall declines. RigDigBi.com mines data from all inspections of trucks/drivers for property carriers with an associated U.S. DOT number and for-hire authority.
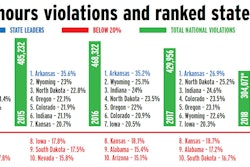
Compared to the previous year, only North Carolina was new among the top 10 states ranked by the number of inspections conducted per lane-mile of National Highway System in the state, shown above. North Carolina climbed up the rankings in a big way, boosting its inspection total by nearly 16,000 inspections in 2017 over the prior year. It’s the first time that the state has appeared in the top 10 since Overdrive began tracking inspections-per-lane-mile in 2012.

Maj. Freddy Johnson with the North Carolina Department of Public Safety, the federal Motor Carrier Safety Assistance Program lead in the state, assumed his position at the head of the unit in March 2017. He says he helped the department to focus more on improving the state’s position in truck- and bus-involved crash fatalities. “We’re in the top 10” among states in that metric, too, he says.
A look at North Carolina’s violation priorities reveals a slight shift in emphasis from vehicle-related violations to truckers’ hours of service. While violations per inspection declined a bit in North Carolina in 2017 with an influx of more clean inspections, hours of service violations made up a greater share of total violations the state issued, moving a percentage point upward to 8.5 percent. That percentage ranks well down the list of states when it comes to hours of service focus, however, at No. 36.
A $19.7 million investment in a weigh and inspection station at the port of entry from South Carolina on I-85 was completed in November 2016. The new site was operational throughout 2017, from which the numbers above are drawn, though most of North Carolina’s increase in inspections seems to have come from roadside patrols. The percentage of fixed-location inspections fell by a percentage point in 2017 from 2016.