Follow this link for the previous part in this series.

One challenge in framing the trucking labor situation is that “labor shortage” can mean different things. Today it’s considered to describe a condition where demand is greater than supply at current market prices. In essence, that’s what ATA and FTR Transportation Intelligence attempt to illustrate with their driver shortage tracking.
But a perhaps more traditional definition describes not supply/demand imbalances at current market prices but a shortage of manpower to do the job at any price. This might be seen during mass mobilizations during wartime, or in an industry needing workers with a rare technical skill. This kind of labor problem can be implied in driver shortage stories that suggest a disruption to the supply chain that consumers will see and feel.
Peter Capelli, a management professor at the Wharton School of Business at the University of Pennsylvania, has written widely on consultancies’ and business associations’ claims about skill gaps/shortages in the U.S. labor force. He’s cast a critical eye at such reports’ refrains of “skill gaps, skill shortages and skill mismatches.”
Much of the evidence of such shortage claims is not apparent in market analyses, Capelli notes in a 2012 report on the subject, but rather “comes directly from employers … who report difficulties hiring the kind of workers they need” rather than “where labor market experts might expect to see [evidence], such as in rising wages.”

ATA and FTR defend their driver shortage numbers as being based on more than simply what employers say. ATA relies on “demographic driver data, population growth by age data, tractor counts and projected economic and industry growth information,” as noted in its 2015 driver shortage analysis.
FTR developed its methodology in the years following ATA’s 2005 shortage report, says Jonathan Starks, chief operating officer. It takes into account not only “demographic shifts and workforce patterns” but also estimates of effects from regulatory changes and business cycles.
As for Capelli’s point about the conspicuous absence of rising wages as evidence in so many labor-shortage reports, ATA and FTR point to various economic and trucking industry factors.
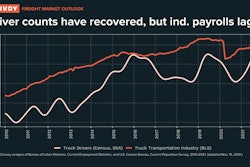
Bob Costello of the ATA links the declines in inflation-adjusted income and pay numbers with the fall in per-truck miles caused by the Great Recession. “Our data, which includes all types of truckload freight … shows average miles per truck per month fell over 25 percent from 2007 through 2012,” he says. Since then, miles per truck are “up 6 percent, but still off significantly overall.”
ATA’s 2015 shortage analysis acknowledges surplus numbers in the driver supply/demand equation in the worst years of the recession, with the shortage returning in slight form in 2011.
Starks, too, sees the forces behind the up-and-down “lumpiness” of the long recovery from the recession as the principal reason for anemic driver pay.
Timeline | 2009 – “The only time I don’t remember the ‘driver shortage’ and ‘underpaid drivers’ being the biggest issue of conversation was 2009 and 2010, the Great Recession!” – ATBS President Todd Amen
Starks describes a significant disconnect between shippers’ and carriers’ views of pricing throughout the post-recession period, making rate growth – and consequently driver pay growth – less possible. Because many shippers were growing only modestly, “their expectations for transportation price increases were low.”
Starks says his company’s driver shortage trend estimates offer value mainly because “there are no real actual numbers” of drivers short. A trend of growing numbers in his view illustrates a market that isn’t operating “as efficiently as it potentially could” and getting worse.
When combined with capacity utilization numbers, averaging above 95 percent in recent years, Starks says, the driver shortage estimate has been a good indicator of when pricing will in fact move, as it did significantly in 2014 and, less so, this past year. Based on current trends, he adds, 100 percent utilization could come by 2017, and the market “will have to respond.”
The industry’s typical cycle of pay advances takes 33 to 36 months, Klemp says. It starts when a major fleet is the first in a long time to announce a major pay raise. It ends when the last of the large influential fleets brings its pay in line.
“It did it this time in 17 months,” Klemp says, starting in 2014 with U.S. Xpress. That compressed cycle indicates a strong sense of a driver shortage.
Timeline | 2010 – With the impending advent of the CSA program, FTR Associates estimates a current shortage of about 10,000 drivers but warns of a 124,000-driver shortfall by late 2011.
Owner-operator Lester sees the driver shortage debate and statistics as the “same old thing we’ve been talking about for the last 30 years”: how to pay drivers adequately for a tough job in a competitive market.
“I hate to hear that there’s such a dilemma when I just can’t see it,” he says. “What do football teams do? They throw gobs of money at players because they know these guys are who they want. The market demands it. There’s just not that many players that are out there who are first-rate. They get these unbelievable contracts because they’re a rare breed. Are drivers that rare of a breed? I would like to think that.” –Max Heine contributed to this report.
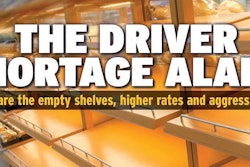
Next in this series: Driver shortage: Where are the empty shelves?