Trucking news & briefs for July 22, 2021
Contract freight tonnage on flat trajectory through June
The American Trucking Associations’ long-running seasonally adjusted For-Hire Truck Tonnage Index lost another 1.5% in June after falling 1% in May.
ATA Chief Economist Bob Costello called it a sign of contract freight volumes having “flattened out, on average, over the last six to nine months.”
 Year-to-date, compared with the same six months in 2020, tonnage is up 0.3%. The not seasonally adjusted index, which represents the change in tonnage actually hauled by fleets before any seasonal adjustment, equaled 116.2 in June, 2.4% above the May level. In calculating the index, 100 represents 2015.
The bit of good news in the update was that tonnage levels remain “slightly above 2020 levels" for the same months, he added. “Supply chain issues are likely putting some downward pressure on tonnage” in the contract market.
Industry-specific supply constraints themselves could also be factors in the flat trajectory, at once. "For-hire truckload carriers have seen their tractor counts fall because they are having difficulty finding qualified drivers" they want, he said. "It is difficult to move more tonnage with less equipment," sending volume to the spot market, where many independent owner-operators do business.

This spot volume index, meanwhile, hit record highs
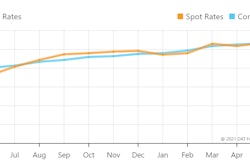
Truckload freight volumes hit new highs in June and spot and contract rates stayed in record territory as surging retail imports and peak produce shipments fueled demand for transportation services, said DAT Freight & Analytics, operator the DAT freight marketplace.
The DAT Truckload Volume Iindex sat at 237 in June, an 11% increase compared to May and a record high.
 The Index is an aggregated measure of dry van (shown here), reefer and flatbed loads moved by truckload carriers and an industry-standard indicator of commercial freight activity. A baseline of 100 reflects freight volume in January 2015.
The national average rate for van loads on the DAT One load board network was $2.68 per mile in June, down 1 cent from the all-time high in May (all rates are all-in, reflecting fuel as well as linehaul rates' movement). The national average spot rate for refrigerated freight fell 1 cent to $3.10 per mile month over month, while the flatbed rate increased 3 cents to $3.15.
Contract truckload rates set records for all three equipment types:
- Van: $2.73 per mile, up 6 cents compared to May
- Reefer: $2.88 per mile, up 3 cents
- Flatbed: $3.10, up 7 cents
Load posts were on the decline overall, however, falling 6% over the course of the month, compared to May, potentially a shift from the spot market toward more freight moving under contract. More truckers were searching for loads, at once, reducing overall demand by a small margin.
Load-to-truck ratios declined for all three equipment types on the spot market. The national average van ratio was 5.6 in June, meaning there were 5.6 available loads for every van posted to the DAT network, down from 6.1 in May. The reefer ratio was 11.6, down from 13.0, and the flatbed ratio slipped from 97.1 in May to 66.8 last month.
All the same, said Ken Adamo, DAT's analytics chief, “overall demand accelerated at a faster pace" than post volumes fell.. "The typical seasonal decline in contract and spot rates from now to Thanksgiving looks less likely in 2021.”
Spot report for the last week
Truckstop.com and FTR Transportation Intelligence charted a decline last week in both dry and reefer volume on the spot market as further signs of a "normalizing" market "after more than year of extraordinary stress," FTR said.
 Overall market temperature was on the decline in the last week, according to the Truckstop.com/FTR Transportation Intelligence coproduced Market Demand Index.
Total load postings in the Truckstop.com system fell 5.6% during the week ended July 16, but the declines in dry van and refrigerated were similar to those during the prior week, which had been negatively affected by the July 4 holiday.
Another week or two should yield data to present a clear picture – added variability in the analysis following a holiday-shortened week is always the case.
June typically marks a peak in the market, but additional stimulus is once again hitting the economy as the child tax credits started arriving in bank accounts last week. Many supply chains are still constrained and capacity remains tight for a variety of reasons. All of this is leading to support for spot market volumes, even if they aren’t staying at the "stratospheric" levels of the last year.