Where are you most likely to find yourself or your truck under the microscope of a law enforcement representative? For the second year in a row in Overdrive’s ongoing look into enforcement trends and the Compliance, Safety, Accountability program, Maryland garners that distinction.
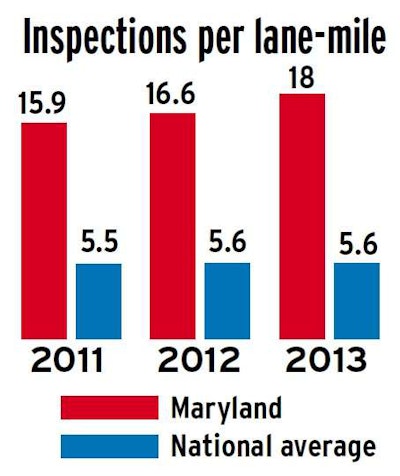
In 2013, Maryland enforcement officials conducted 18 inspections for every lane-mile of National Highway System roadway within the state, up from 16.6 in 2012. The state benefited from a 12.5 percent boost in federal dollars coming into the program in 2013 to help achieve that increase.
|
ENFORCEMENT: ALL ABOUT REVENUE? Responsible officers, he says, use tickets as a means to a safety end. Depending on the carrier’s background, “They might write a $75 ticket for a fire extinguisher,” he says, rather than hit the same carriers for a “brake violation that could have been $500.” If the agency has a lot of problems with the carrier, Dofflemyer explains, a hefty fine can be a way to “get his attention.” Dofflemyer, aware of abuses or errors by some officers, says he periodically pulls a random 5 percent of all tickets to look for anomalies. “I had one guy who was writing a ticket for each tire,” he says. “That’s not quality enforcement.” |
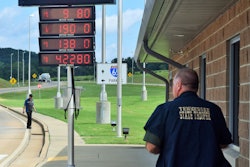
And as says Capt. Norman “Bill” Dofflemyer, commander of the Commercial Vehicle Enforcement Division of the state police, reflecting the nationwide drift away from the scale houses to more mobile enforcement, “We’re doing more and more.”
Only 66 percent of Maryland’s inspections were conducted at a fixed location last year, down from 72 percent in 2011. “While we still operate the fixed facilities, we’re doing a lot more mobile traffic enforcement,” says Dofflemyer. “We normally do inspections on everything we stop.” That can mean a Level 2 walk-around inspection, Level 3 credentials or, less likely, a more detailed full Level 1.
While the “scale house has a place” as an inspection facility, “the way we’ve been looking at it, with the scale houses on interstate routes, the crash problems aren’t always in those areas. We attack areas where we have a crash problem,” such as the Capitol Beltway and U.S. Highway 301. “We’ve been below the national average” in terms of the truck-involved crash rate, he says, but it “picked up a little last year with the recovering economy.”
Targeting crash-prone areas isn’t the only mobile-enforcement priority, however. Dofflemyer relays an anecdote about a trend in violations he noticed in Prince George’s County. State police put together a task force with other agencies that have certified inspectors “to flood the area for a week,” he says.
Such actions, Dofflemyer says, contribute to the state’s strong record in maintenance violations. The share of overall maintenance violations Maryland issued in 2013 ranked No. 9 among the continental U.S. states at 71 percent. It’s No. 11 in light violations, 22 in brakes and 14 in tires.
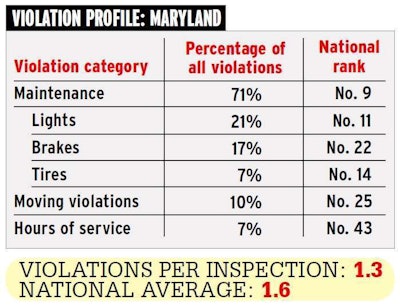
For moving violations, the state’s sitting right around the mean at No. 25, and it’s near the bottom in hours enforcement. Only 7 percent of violations in 2013 had anything to do with the logbook.
 For this and the next several months, we’ll profile states that stand out for their enforcement intensity, violation propensity or other reasons. For more detail by state, you can access interactive maps charting a raft of enforcement data via Overdrive’s CSA’s Data Trail site at this link.
And while Maryland is quite likely indeed to delay your trips across its borders with an inspection, that closer look could help your or your carrier’s CSA Safety Measurement System rankings: 47 percent of Maryland’s inspections in 2013 were violation-free clean inspections, compared to 40 percent nationwide.
Find the 2013 inspection-intensity top 10 below. Numbers are total 2013 inspections per lane-mile of National Highway System roadway. Source for data: Unless otherwise noted, all are federal data analyzed by Overdrive and RigDig Business Intelligence.


