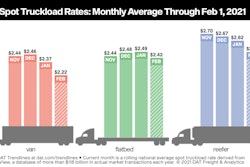
National average spot truckload van and refrigerated rates were virtually unchanged from the prior week during the week ending Feb. 7, a sign of price stability after January’s declines, said DAT Freight & Analytics, which operates the DAT load board network. Here's how that first week of February compares to the prior month overall:
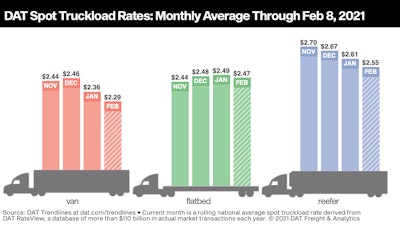 These are national average spot rates through February 8. They're "all in." Recent average estimated linehaul figures -- minus a calculated average surcharge -- are available in this story for vans from just under two weeks ago, showing the downward trend amid rising fuel prices.
Dry van load post volumes increased 7% and the number of posted trucks was virtually unchanged compared to the previous week -- the average van load-to-truck ratio was 4.5, up from 4.3 the previous week and 3.2 the week before. The average rate was higher on 58 of DAT’s top 100 van lanes by volume last week.
Port volatility | Port markets across the country have experienced huge swings in demand for trucks recently. Volumes in Elizabeth, New Jersey, increased 7% compared to the previous week, and the average outbound rate rose 3 cents to $1.90 per mile. On the West Coast, outbound load volume from Los Angeles dropped 14% week over week; in nearby Ontario, the decline was 8%. Tighter capacity in both markets lifted the average outbound rate by 2 cents to $2.35/mile and $2.43/mile, respectively.

Reefer demand up even with rates down most lanes | Spot reefer load posts on the DAT network increased 13% last week with very little change in the number of trucks posted. The national average reefer load-to-truck ratio edged higher from 8.6 to 9.9 as a result. One driver of reefer demand: shippers needed temperature-controlled trailers to keep loads from freezing as cold winter weather hit much of the country last week, with further spread of that cold expected through this week.
The number of loads moved on DAT’s top 72 reefer lanes by volume was up 1.8% compared to the previous week. The average spot reefer rate was higher on 19 of those lanes, lower on 39 and neutral on 14.
Further demand drivers -- it’s peak season for winter strawberries in Florida. Growers shipped 76% of their annual volume between Jan. 25 and March 28 last year at an average of 72 truckloads per day, according to the USDA. Last year, Valentine’s Day was the busiest shipping day of the year for winter strawberries.
Flatbed demand on the upswing | Flatbed load and equipment posts each increased 2% last week, leaving the national average load-to-truck ratio virtually unchanged at 52.8. Load post volumes in our top 10 flatbed markets increased by just under 1% compared to the previous week. However, the number of loads moved on the top 78 flatbed lanes was up 13.2%, and the average spot rate was higher or neutral on 59 of those lanes.
Residential construction is helping. The U.S. Census Bureau reported a 1% increase in construction spending during the month of December compared to November, but that doesn’t tell the whole story. Residential activity was up 3% month over month while nonresidential construction spending declined 1.7%.
Contract rate dynamics: Contract freight represents around 85% of all truckload freight hauled. Changes in contract rates typically lag spot rates by four to six months, and the extent to which contract rates rise is driven by how long spot rates are at elevated levels.
Shippers put out a lot of RFPs (requests for proposal) late in the third quarter and throughout the fourth quarter last year when spot rates were at record highs. Those 2021 contract rates are now making their way into routing guides — the rates that carriers bid on certain lanes and how much capacity they commit to provide throughout the year.
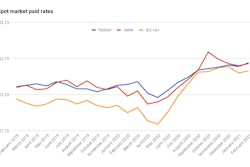
Higher contract rates could mean lower spot market rates over time, and high diesel prices can erode margins further. It’s still a good pricing environment for truckers, but the price of fuel and the gap between contract and spot rates bears watching. For flatbed, contract and spot rates have tracked with each other, with contract above spot, for the entirety of last year. For van and reefer, after spot rate averages rose above contract averages mid-2020, pushing contract higher as well over time, the recent spot declines have narrowed the gap to very close to even as of the end of January.
