There have been some notable additions to this category ranking of states’ enforcement departments since Overdrive last published them in 2018, which relied on calendar 2017 data to make the rankings. Since that time, too, moving violations — of the type that contribute to the Unsafe Driving category of the CSA program‘s Safety Measurement System — continue to represent a greater and greater share of total violations issued nationwide.
Since 2016 (see graph below), moving violations’ share has crept higher every single calendar. That continues something of a long-running trend nationally, though equipment-related violations still account for the lion’s share of violations with a national average of 75.8%, given longstanding practice among many states and, of course, the myriad of things that can go wrong with a truck.
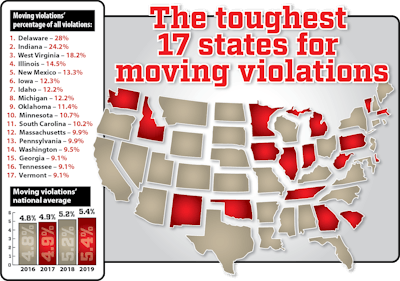 Source for data: RigDig analysis of federal inspection/violation data for calendar year 2019. Follow this link to compare this not-so-round top 15 (a bonus +2 with the 15th-place three-way tie) with 2017 data.
The Commercial Vehicle Safety Alliance’s Operation Safe Driver Week, beginning Sunday, July 12, puts the enforcement focus around the nation on driver behavior around a large truck or by that truck’s driver, CVSA notes. Statistics compiled from traffic enforcement initiatives over the week in past years, some owner-operators may take heart in, show clearly a more sizable targeting of motorists’ actions than those of the professionals. After last year’s event, also in July, CVSA reported passenger vehicle drivers “were issued 16,102 citations and 21,001 warnings,” compared to a dramatically lower level for truck and bus drivers: 1,454 citations and 2,126 warnings, for moving-type violations.

At once, in July 2019, when last year’s Operation Safe Driver event was held, from the national perspective moving violations marked on commercial vehicle inspection reports made up a full percentage point greater share than the average for the year. “We ask jurisdictions to focus on moving violations” for the week, CVSA Director of Crash and Data Programs Chris Turner said. Those “can include [commercial motor vehicles] when they are the vehicle whose driver committed the violation.”
In some of the top five states shown above, July 2019 enforcement efforts were equally, if not more so, focused on moving violations. Delaware‘s moving violation share among its total violations was almost 6 points higher in July than the average for the year, Indiana‘s 2.5 points up, West Virginia showing an extra 7.5 percentage points, and Illinois and New Mexico about level with their 2019 average.
When it comes to roadside stops of trucks, more involved inspections do routinely occur, Turner added. “Normally, a Level 3 [driver] inspection,” which includes a credentials and hours of service check, “will take place when a CMV is stopped, as the inspection is the mechanism to report the violation to FMCSA through the inspection software.”
Common Level 1 and 2 inspections, involving the truck, are less likely at roadside unless a vehicle violation is observed, Turner noted. In its accounting of results from last year’s event, CVSA reported more than 6,170 citations and 27,163 warnings issued to truck and bus drivers as a result of such observed violations after a traffic stop during Operation Safe Driver. Examples it cited included mirror equipment violations, expired license plate tags, non-working lamps,” and the usual brakes and tire violations.
To get a feel for where inspections and roadside enforcement activity are most likely during Operation Safe Driver, in addition to the list above cross-reference it with the top 10 states when it comes to Overdrive‘s updated inspection intensity analysis, based on calendar year 2019 data, below. States appearing on both lists might well be good bets to be particularly active patrolling the roads for mistakes and issues come July 12.
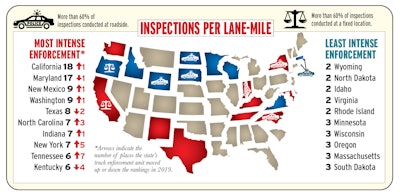 In addition to Indiana, New Mexico, Washington and Tennessee, among both lists’ top states, consider these others just below the top 10 in inspection intensity and not shown on this map: No. 11 Delaware, No. 12 Pennsylvania and No. 16 Iowa. Perennial leaders in this metric, California and Maryland, as illustrated in the graphic above, swapped places for 2019 since the last time Overdrive made these rankings for 2017. States showing the highest inspection rates are good bets for experiencing enforcement, and not just during inspection/enforcement blitz events like Operation Safe Driver Week. Overdrive‘s annual accounting of states’ truck enforcement efforts has been ongoing most years since 2013, the first year the CSA’s Data Trail series was published, amid growing consternation about the CSA SMS’s methodology’s fairness, state-to-state enforcement variability and more. Find plenty more coverage from the archives via this link.
Operation Safe Driver Week runs officially through Saturday, July 18. For further resources, access related inspection-prep coverage as well as state enforcement department profiles of some of the toughest moving-violation states from our past CSA’s Data Trail series below:


